Revisiting Conference Ratings
In the past, I've included a conference summary in my analysis of Kenneth Massey's rating comparison data. That wasn't a conference ranking, it was just a summary of teams' ranks, and the order was based upon highest-ranked team in the conference.
For the 2009 season Dr. Massey has added conference rankings to his presentation, so I have altered my report to order conferences based upon a ranking similar to his. My order may not be exactly the same as the one on Dr. Massey's page becasue:
- I do not include the human polls - AP, Coaches, Legends or Harris. I also often exclude computer ratings that fail to rank all BCS teams.
- I count Notre Dame as a separate "conference" from the other Independents, because of their BCS affiliation. (No, I don't like that either, but it is what it is.)
Note that only the order in which the conferences are listed on my report has changed. All of the data in the report is still based upon the results presented in the "Majority Consensus Summary" section of my analysis, and the team rankings on the report are not the basis of the order.
This is as good a time as any to review alternative methods of summarizing ratings at a group level.
The group might be conference, or it might be the list of a team's opponents. Aside from providing
ammunition for bar arguments, there are some good reasons to do this.
Averages of ranks are not always the best way to characterize conference strength (though that of Dr. Massey is better than most because of the sheer number of data points included in the average - #teams in conference × #ratings.)
Often it is helpful to know something about the distribution of teams' ranks (or rating values, see below) - one really bad team in a conference can have a serious affect on the average for a conference that remains nonetheless very difficult to achieve a good conference record for the teams playing their conference schedule.
It is a little harder to create a metric that depends upon distribution when working with ranks: there's not as much difference between #40 and #60 as there is between #10 and #30. A few years ago I chose to use something I called the
Weighted Median. A truly terrible name (it's really a "shifted" median), but essentially it adjusts conference ranks by how top or bottom -heavy the conference is based upon its constituent teams' ranks.
| ix | #Teams | WtdMed | Best | Med | Worst | Conf | T1 | T2 | T3 | T4 | T5 | T6 | T7 | T8 | T9 | T10 | T11 | T12 | T13 |
| 1 | 12 | 6.42 | 3 | 26 | 98 | B12 | 3 | 4 | 12 | 17 | 21 | 26 | 27 | 60 | 67 | 72 | 78 | 98 | |
| 2 | 12 | 14.08 | 17 | 34 | 80 | ACC | 17 | 20 | 29 | 31 | 33 | 34 | 36 | 42 | 50 | 51 | 58 | 80 | |
| 3 | 10 | 15.5 | 3 | 30 | 111 | P10 | 3 | 12 | 16 | 19 | 30 | 46 | 56 | 62 | 100 | 111 | | | |
| 4 | 8 | 19.75 | 25 | 33 | 94 | BigE | 25 | 27 | 32 | 33 | 40 | 47 | 76 | 94 | | | | | |
| 5 | 12 | 20.92 | 1 | 45 | 81 | SEC | 1 | 10 | 13 | 14 | 18 | 45 | 45 | 48 | 50 | 52 | 54 | 81 | |
| 6 | 1 | 34 | 47 | 47 | 47 | ND | 47 | | | | | | | | | | | | |
| 7 | 11 | 35.27 | 6 | 48 | 100 | B10 | 6 | 7 | 21 | 36 | 47 | 48 | 55 | 65 | 66 | 69 | 100 | | |
| 8 | 9 | 77.11 | 11 | 75 | 109 | MW | 11 | 11 | 27 | 60 | 75 | 81 | 89 | 96 | 109 | | | | |
| 9 | 2 | 84 | 59 | 59 | 111 | Ind | 59 | 111 | | | | | | | | | | | |
| 10 | 9 | 104 | 12 | 82 | 119 | WAC | 12 | 61 | 72 | 77 | 82 | 96 | 103 | 116 | 119 | | | | |
| 11 | 12 | 104.92 | 42 | 86 | 114 | CUSA | 42 | 51 | 54 | 55 | 62 | 86 | 87 | 90 | 93 | 100 | 113 | 114 | |
| 12 | 13 | 123.23 | 65 | 93 | 115 | MAC | 65 | 71 | 73 | 76 | 79 | 89 | 93 | 94 | 100 | 103 | 106 | 109 | 115 |
| 13 | 9 | 134.56 | 61 | 97 | 119 | SBC | 61 | 88 | 92 | 96 | 97 | 101 | 107 | 117 | 119 | | | | |
|
is an example using the September 3, 2009 Majority Consensus report to assign ranks to teams. You'll notice that for conferences with an even number of teams I don't use the arithmetical median - I choose the best rank that includes at least half the teams in the conference.
Average Values
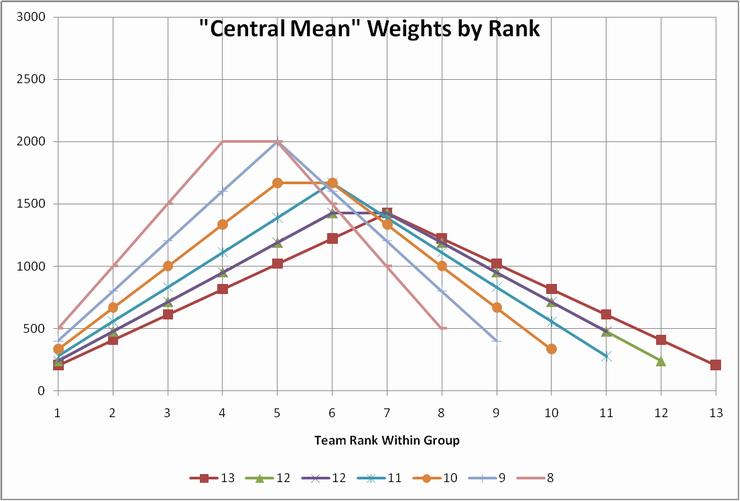
When we have access to a rating's values (not just ordinal ranks) we can do a better job of characterizing the distribution. For example, Jeff Sagarin uses a weighted average he calls the Central Mean to discount the effects of outliers at the top and bottom of the conference team list. Graphically, his weights by team rank within conference look like this:
 (Divide the values on the vertical axis by 100 to get percentage contributions for each rank.)
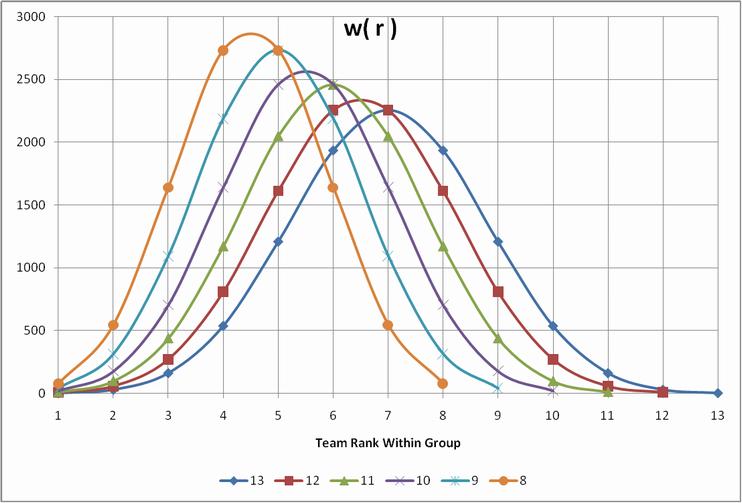
For the ratings I calculate, I'll use an even more extreme emphasis to calculate a weighted average:

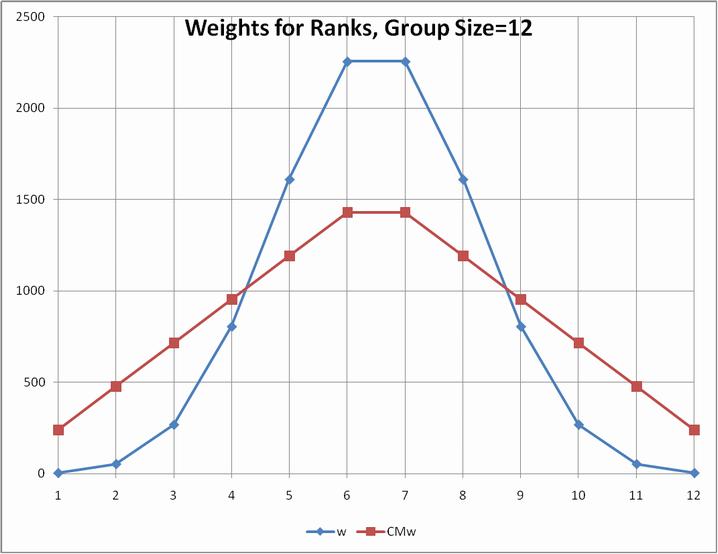
Comparing the two weighting systems for group size 12 shows how extreme my choice is compared to Sagarin's:
 It may surprise you as much as it did me that the resulting weighted averages are nearly identical when applied to the Sagarin ratings (the ones I calculate will not be available until after the third weekend.)
| #Teams | CM | WtdAvg | Rank | Conf | T1 | T2 | T3 | T4 | T5 | T6 | T7 | T8 | T9 | T10 | T11 | T12 | T13 |
| 12 | 79.76 | 79.28 | 1 | SEC | 93.95 | 88.55 | 86.59 | 83.93 | 80.60 | 79.39 | 78.72 | 76.95 | 76.55 | 75.24 | 73.49 | 67.88 | |
| 10 | 78.30 | 78.38 | 2 | P10 | 95.75 | 85.07 | 83.86 | 83.32 | 78.47 | 78.10 | 74.57 | 71.90 | 67.35 | 66.60 | | | |
| 12 | 78.25 | 78.33 | 3 | B12 | 92.19 | 90.95 | 84.16 | 83.07 | 80.09 | 80.08 | 79.45 | 73.19 | 72.59 | 71.39 | 67.10 | 65.37 | |
| 12 | 77.64 | 77.62 | 4 | ACC | 85.98 | 82.30 | 81.65 | 81.40 | 78.92 | 77.56 | 76.93 | 76.19 | 76.11 | 73.98 | 73.01 | 65.06 | |
| 8 | 76.34 | 76.66 | 5 | BigE | 84.48 | 77.41 | 77.37 | 77.34 | 76.96 | 74.91 | 74.88 | 63.76 | | | | | |
| 11 | 75.93 | 75.65 | 6 | B10 | 89.29 | 86.58 | 79.63 | 78.32 | 77.66 | 76.36 | 73.17 | 71.92 | 71.55 | 70.05 | 64.06 | | |
| 1 | 75.02 | 75.02 | 7 | ND | 75.02 | | | | | | | | | | | | |
| 9 | 71.28 | 70.78 | 8 | MW | 84.18 | 83.49 | 80.81 | 73.40 | 69.82 | 67.39 | 63.31 | 62.46 | 61.23 | | | | |
| 2 | 65.02 | 65.02 | 9 | Ind | 72.85 | 57.18 | | | | | | | | | | | |
| 12 | 64.56 | 64.37 | 10 | CUSA | 73.69 | 71.21 | 70.69 | 69.87 | 65.00 | 64.83 | 62.96 | 62.92 | 62.73 | 59.56 | 56.04 | 56.03 | |
| 9 | 63.59 | 63.48 | 11 | WAC | 82.93 | 70.38 | 69.95 | 67.83 | 61.90 | 61.38 | 56.92 | 54.14 | 50.77 | | | | |
| 13 | 61.23 | 61.05 | 12 | MAC | 67.29 | 65.24 | 65.11 | 64.90 | 63.21 | 61.01 | 60.47 | 60.33 | 60.31 | 58.67 | 58.44 | 56.69 | 55.04 |
| 9 | 58.88 | 58.88 | 13 | SBC | 70.04 | 62.22 | 60.96 | 59.54 | 59.12 | 58.28 | 56.48 | 53.84 | 50.73 | | | | |
|
See Weigted Average definition for the derivation of the weights I will use.
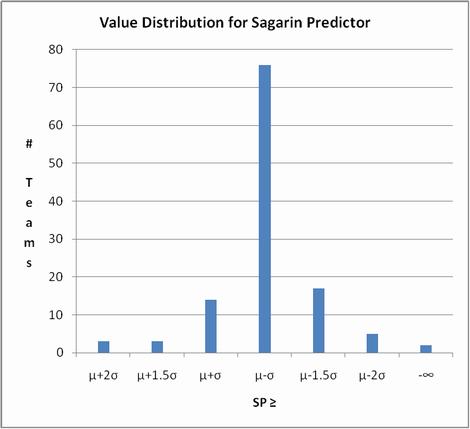
What has become my favorite characterization of conference strength is based upon the fact that advanced ratings usually have values distributed normally - the "bell curve." Using Sagarin's pre-season ratings as an example (since mine aren't available until after the third weekend) we find:
 We can assign letter grades to the teams in each bucket left to right as A+ for teams' whose rating is more than 2 standard deviations above average, A for those more than 1.5 SDs above average, B for those > 1 SD above averaage, C for those whose values are within ± 1 SD of the average, and D, E, F as indicated. Then just calculate a "GPA" for each conference to use as the sort key.
In practice I divide the C bucket into C+, C and C- at average ± ½ SD. The results for the pre-season version of Sagarin's ratings:
| Ix | Conf | A+ | A | B | C+ | C | C- | D | E | F |
| 1 | SEC | 1 | 1 | 2 | 4 | 4 | 0 | 0 | 0 | 0 |
| 2 | P10 | 1 | 0 | 3 | 2 | 4 | 0 | 0 | 0 | 0 |
| 3 | B12 | 1 | 1 | 2 | 3 | 4 | 1 | 0 | 0 | 0 |
| 4 | B10 | 0 | 1 | 1 | 3 | 5 | 1 | 0 | 0 | 0 |
| 5 | ACC | 0 | 0 | 2 | 5 | 4 | 1 | 0 | 0 | 0 |
| 6 | BigE | 0 | 0 | 1 | 4 | 2 | 1 | 0 | 0 | 0 |
| 7 | MW | 0 | 0 | 2 | 1 | 3 | 2 | 1 | 0 | 0 |
| 8 | ND | 0 | 0 | 0 | 0 | 1 | 0 | 0 | 0 | 0 |
| 9 | WAC | 0 | 0 | 1 | 0 | 3 | 1 | 2 | 1 | 1 |
| 10 | Ind | 0 | 0 | 0 | 0 | 1 | 0 | 1 | 0 | 0 |
| 11 | CUSA | 0 | 0 | 0 | 0 | 4 | 5 | 1 | 2 | 0 |
| 12 | MAC | 0 | 0 | 0 | 0 | 1 | 4 | 7 | 1 | 0 |
| 13 | SBC | 0 | 0 | 0 | 0 | 1 | 1 | 5 | 1 | 1 |
| | | | | | | | | | |
| | SP≥ | μ+2σ | μ+1.5σ | μ+σ | μ+½σ | μ-½σ | μ-σ | μ-1.5σ | μ-2σ | -∞ |
| | All: | 3 | 3 | 14 | 22 | 37 | 17 | 17 | 5 | 2 |
|
For my ratings this year I'll report the weighted median summary, the weighted average, and the "GPA" report for conference characterizations.


