A simple average of a conference's teams' rating values can be misleading - a conference with one very good team or one really bad team has an average that might not be representative of overall conference strength. Here's a weighted average that gives most of the weight to the middle third of the conference's teams.
For a conference containing n teams, order the teams by ratings ρ(t) to assign each team a rank from 1 to n, let tr be the rth team in the list,
then define the conference rating by:
| ρ(conf) = | n |
| ∑ | w(r) × ρ(tr) |
| r=1 |
with
|
|
| n |
| ∑ | C(n-1,r-1) | = 2(n-1) so | ρ(conf) | is a weighted average with weights defined by conference size n. |
| r=1 |
|
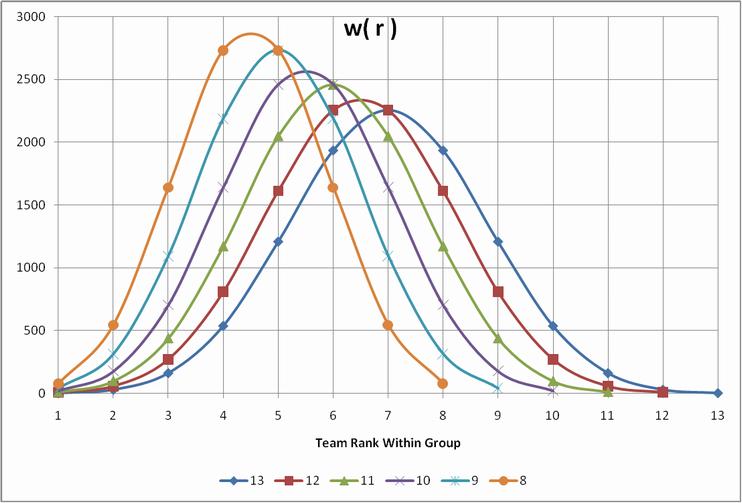
The weights for "conference" sizes 1 through 13 are:
Group
Size | Teams' Ranks Within Group |
| 1 | 2 | 3 | 4 | 5 | 6 | 7 | 8 | 9 | 10 | 11 | 12 | 13 |
| 13 | 2 | 29 | 161 | 537 | 1208 | 1934 | 2256 | 1934 | 1208 | 537 | 161 | 29 | 2 |
| 12 | 5 | 54 | 269 | 806 | 1611 | 2256 | 2256 | 1611 | 806 | 269 | 54 | 5 | |
| 11 | 10 | 98 | 439 | 1172 | 2051 | 2461 | 2051 | 1172 | 439 | 98 | 10 | | |
| 10 | 20 | 176 | 703 | 1641 | 2461 | 2461 | 1641 | 703 | 176 | 20 | | | |
| 9 | 39 | 313 | 1094 | 2188 | 2734 | 2188 | 1094 | 313 | 39 | | | | |
| 8 | 78 | 547 | 1641 | 2734 | 2734 | 1641 | 547 | 78 | | | | | |
| 7 | 156 | 938 | 2344 | 3125 | 2344 | 938 | 156 | | | | | | |
| 6 | 313 | 1563 | 3125 | 3125 | 1563 | 313 | | | | | | | |
| 5 | 625 | 2500 | 3750 | 2500 | 625 | | | | | | | | |
| 4 | 1250 | 3750 | 3750 | 1250 | | | | | | | | | |
| 3 | 2500 | 5000 | 2500 | | | | | | | | | | |
| 2 | 5000 | 5000 | | | | | | | | | | | |
| 1 | 10000 | | | | | | | | | | | | |
|
(Here I've multiplied the weights by 104 to make the table easier to read.) Graphically,