Now, figuring out how a home field advantage is manifested in points is a really hard problem. This is especially true for college football because by the time you have enough data points to study you've got different team compositions in the mix. There's nowhere near enough neutral-site games to serve as a control, and throw in that there's no way to tell if a home team that lost would've lost by more had it been a road game and one wonders if it's worth the effort.
The best study I've read about was done by Boyd Nation using D1 baseball conference games over multiple seasons. Baseball provides enough games, and in two or four -season periods conference games between team-pairss come in nearly equal home-and-home increments. Choosing conference games minimizes the noise influence of the tendency of "power" teams to play non-power teams exclusively at home. Boyd's results were framed in terms of winning percentage, with the result being that home field made a difference in the outcome about 10 per cent of the time.
There is some evidence that to all D1 team-sports are about the same in this regard. When they introduced the home court adjustment to the RPI I repeated it using just two years of basketball conference game results and various studies I've done on D1 football give approximately equal outcomes. Football is harder for the reasons stated above but when teams of "the same class" are used, the home team winning percentage gets closer to .55 as the definition of "class" is refined.
ΔMargin = (average margin when home team wins) − (average margin when road team wins)which for 2018 after the regular season looks like this:
ΔMargin actually starts out much larger early in the year and is always larger than the one people who are better at this than I am came up with, so I used ½ΔMargin to align my HFA with the ones published along with other ratings. That seemed justifiable on the idea that about half the time the venue didn't matter - the better team would've won had the game been played away instead of at home. That was just a naive ad-hoc adjustment, and I'm a bit embarrassed that I didn't immediately identify my mistake.
#HW Mar #RW Mar #N Mar — HW% ΔMar D1 869 20.52 549 16.11 44 15.50 0.613 4.41
The real reason that ΔMargin came out too high is that the average is dominated by all the 1AA @ 1A games, where the home team would win by a landslide even were it a visitor.
If we use only 1A vs 1A and 1AA vs 1AA games we get a more reasonable 0.586 home winning percentage and ΔMargin 2.54.
#HW Mar #RW Mar #N Mar — HW% ΔMar 1A v 1A 422 18.25 286 16.22 32 16.56 0.596 2.03 1AA v 1AA 343 19.31 255 16.14 12 12.67 0.574 3.17 1AA @ 1A 104 33.69 7 7.86 0.937 25.83
But there's a similar distinction within 1A. If we divide it into the "power 5" and "group of 5" conferences we see the same phenomenon.
It seems that as difference in team quality is accounted for the magnitude of a universal home field advantage decreases. In fact when we consider just conference games over two seasons it isn't obvious that one exists at all.
#HW Mar #RW Mar — HW% ΔMar P5 @ P5 169 16.13 129 16.75 0.567 -0.62 G5 @ P5 73 26.96 10 12.90 0.880 14.06 P5 @ G5 8 15.13 12 17.42 0.400 -2.29 G5 @ G5 172 16.77 135 15.84 0.560 0.93
That is not nearly as comprehensive as Boyd's analysis but it does support the notion that the home team wins about 10 per cent more often than expected. That leaves open the question of how to describe that in terms of points. It even suggests that my initial notion of using ΔMargin is not likely to be an accurate predictor.
2015 - 2016
Conf #Hwin Hwin #Rwin Rwin #N Neut %HWin Δmargin ACC 56 17.59 55 12.04 3 6.00 0.505 5.55 B10 62 19.32 56 16.32 3 6.67 0.525 3.00 B12 47 19.43 39 17.95 4 14.75 0.547 1.48 P12 61 17.93 47 15.68 2 25.00 0.565 2.25 SEC 61 14.75 48 12.71 5 22.20 0.560 2.05 AAC 56 18.20 42 19.69 0.571 -1.49 CUSA 61 19.80 45 17.29 0.575 2.51 MAC 43 19.79 48 14.19 3 11.00 0.473 5.60 MW 56 15.09 41 17.24 2 5.00 0.577 -2.15 SBC 33 14.58 25 21.40 0.569 -6.82 BSky 56 17.09 36 13.89 0.609 3.20 BigS 12 15.42 10 16.20 0.545 -0.78 CAAF 55 16.82 43 15.30 0.561 1.52 Ivy 27 13.67 26 16.88 0.509 -3.22 MEAC 39 18.26 31 15.65 3 16.33 0.557 2.61 MVC 48 17.44 35 14.51 0.578 2.92 NE 27 14.37 15 15.93 0.643 -1.56 OVC 37 18.22 33 14.30 0.529 3.91 Pat 23 15.91 18 14.39 1 40.00 0.561 1.52 Pio 38 17.71 34 15.76 0.528 1.95 SoCon 36 15.89 30 12.93 0.545 2.96 SLC 52 18.12 45 16.96 2 20.50 0.536 1.16 SWAC 36 23.11 45 20.42 11 18.18 0.444 2.69 All 1022 17.54 847 15.91 39 16.18 0.547 1.63 2016 - 2017
Conf #Hwin Hwin #Rwin Rwin #N Neut %HWin Δmargin ACC 57 18.12 54 13.28 3 15.00 0.514 4.85 B10 73 19.04 53 20.40 2 6.50 0.579 -1.36 B12 40 19.25 46 14.63 5 13.40 0.465 4.62 P12 71 17.89 37 15.59 2 17.00 0.657 2.29 SEC 60 19.00 48 14.52 7 19.86 0.556 4.48 AAC 56 16.27 42 17.14 0.571 -0.87 CUSA 61 17.48 49 13.53 0.555 3.94 MAC 48 16.85 47 14.62 3 10.00 0.505 2.24 MW 53 15.81 44 16.11 1 5.00 0.546 -0.30 SBC 33 16.82 29 15.72 0.532 1.09 BSky 59 16.44 35 15.29 0.628 1.15 BigS 13 20.77 9 14.56 0.591 6.21 CAAF 52 16.54 45 13.51 1 14.00 0.536 3.03 Ivy 28 13.04 27 14.56 1 23.00 0.509 -1.52 MEAC 39 14.49 31 14.00 2 12.50 0.557 0.49 MVC 46 18.13 36 16.67 0.561 1.46 NE 24 15.79 18 15.50 0.571 0.29 OVC 39 14.18 31 13.55 0.557 0.63 Pat 21 15.81 20 16.40 1 40.00 0.512 -0.59 Pio 38 16.58 34 18.88 0.528 -2.30 SoCon 41 15.66 33 14.73 0.554 0.93 SLC 54 17.02 42 19.71 2 23.00 0.563 -2.70 SWAC 35 21.31 38 19.08 11 11.91 0.479 2.24 All 1041 17.14 848 15.79 41 14.93 0.551 1.36 2017 - 2018
Conf #Hwin Hwin #Rwin Rwin #N Neut %HWin Δmargin ACC 61 15.21 51 16.47 2 33.50 0.545 -1.26 B10 71 18.58 55 18.20 2 13.50 0.563 0.38 B12 45 16.64 41 12.76 6 11.50 0.523 3.89 P12 69 15.67 39 14.59 2 5.00 0.639 1.08 SEC 58 19.71 49 17.18 8 12.88 0.542 2.52 AAC 59 17.97 39 15.69 0.602 2.27 CUSA 62 15.31 52 13.79 0.544 1.52 MAC 51 17.69 45 14.69 2 9.00 0.531 3.00 MW 50 16.52 48 15.94 0.510 0.58 SBC 39 19.03 35 14.69 0.527 4.34 BSky 57 18.14 41 17.34 1 21.00 0.582 0.80 BigS 14 26.93 12 19.00 0.538 7.93 CAAF 56 13.59 40 15.68 1 14.00 0.583 -2.09 Ivy 29 17.24 26 14.50 1 23.00 0.527 2.74 MEAC 36 15.19 36 13.86 2 9.50 0.500 1.33 MVC 47 19.09 35 19.34 0.573 -0.26 NE 19 17.58 23 15.30 0.452 2.27 OVC 43 14.53 27 15.70 0.614 -1.17 Pat 18 19.33 24 17.04 0.429 2.29 Pio 47 15.00 29 19.69 0.618 -4.69 SoCon 37 16.32 36 12.61 0.507 3.71 SLC 56 16.61 40 17.40 2 22.00 0.583 -0.79 SWAC 32 20.50 33 16.55 11 9.64 0.492 3.95 All 1056 17.06 856 15.91 40 13.03 0.552 1.16
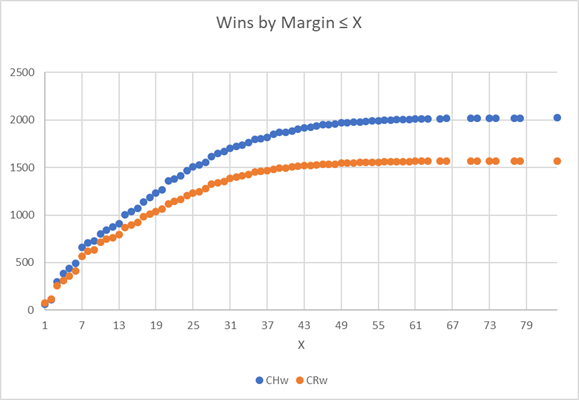
Notice that the slopes of the graphs stay about the same when the margin is less than a score, then the graphs diverge from parallel fairly rapidly when the margin is larger than that. The averages are dominated by the larger values of X where either team would've won regardless of location, and the home average margin is larger because there are more "optional" games where the weaker team visits the stonger. We're interested in the close games, and more than half (52%) of all games were decided by 14 points or less, so we zoom in on that part of the graph.
The slope of the home win graph is greater than that of the road win graph in 1 ≤ X ≤ 4 and then essentially the same until X ≤ 9. So maybe there is a point-value somwehere between 1 and 4 that can be called a home field advantage.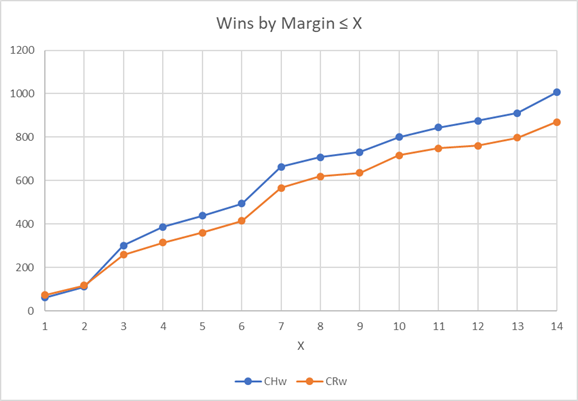
Looking at the graph of home and road wins in non-neutral site conference games with MoV ≤ x for the 2018 season
Season(s) #HW #RW HW% HS RS HS-RS GmS(Home W) GmS(Road W) MarHW MarRW MarHW-MarRW 2014 508 452 0.529 28.49 26.48 2.01 35.82-18.78 35.12-20.24 17.04 14.88 2.16 2015 535 447 0.545 28.66 25.99 2.66 36.85-18.89 34.50-18.86 17.96 15.64 2.32 2016 533 442 0.547 28.87 26.92 1.95 36.18-19.40 35.99-20.05 16.79 15.94 0.85 2017 544 446 0.549 27.78 25.14 2.64 35.60-18.24 33.55-18.23 17.36 15.32 2.04 2018 536 434 0.553 28.97 27.06 1.91 36.51-19.87 35.94-19.66 16.64 16.28 0.36 2-season moving average 2014-2015 1043 899 0.537 28.57 26.23 2.34 36.35-18.84 34.81-19.56 17.51 15.26 2.25 2015-2016 1068 889 0.546 28.76 26.45 2.31 36.52-19.14 35.24-19.45 17.37 15.79 1.58 2016-2017 1077 888 0.548 28.32 26.02 2.30 35.89-18.81 34.76-19.13 17.08 15.63 1.45 2017-2018 1080 880 0.551 28.37 26.09 2.28 36.05-19.05 34.73-18.93 17.00 15.80 1.21 3-season moving average 2014-2016 1576 1341 0.540 28.67 26.46 2.21 36.29-19.03 35.20-19.72 17.27 15.48 1.78 2015-2017 1612 1335 0.547 28.43 26.01 2.42 36.21-18.84 34.68-19.04 17.37 15.63 1.74 2016-2018 1613 1322 0.550 28.53 26.36 2.17 36.09-19.16 35.15-19.31 16.93 15.84 1.09 4-season moving average 2014-2017 2120 1787 0.543 28.45 26.13 2.32 36.12-18.82 34.79-19.35 17.29 15.44 1.85 2015-2018 2148 1769 0.548 28.56 26.27 2.29 36.28-19.09 34.99-19.19 17.19 15.79 1.40 5-season average 2014-2018 2656 2221 0.545 28.55 26.31 2.24 36.19-19.04 35.01-19.41 17.16 15.61 1.55
I decided to find the best fit logarithmic curve for the two series.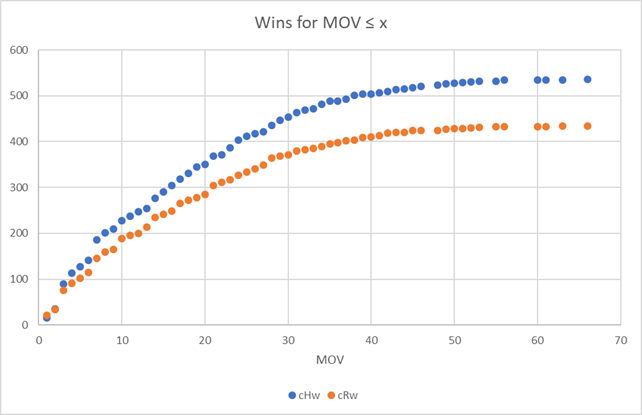
#home wins = 159.49 log mov - 105.9 with R2 0.9648Setting #home wins = #road wins and solving for mov we find that when the margin of victory is greater than 2.19 the home team is more likely to have won.
#road wins = 128.74 log mov - 81.873 with R2 0.9623
Instead of comparing the margin of victory in home wins and losses, it is more illustrative to plot the frequency against home score−visitor score. The home losses show up as negative margins, and the distribution looks appropriately normal.
That is a graph of all non-neutral site conference games from the 2014 through 2018 seasons. The obvious interpretion of home field advantage is the distance the entire normal curve is shifted to the right of the y-axis. In other words, it is just the simple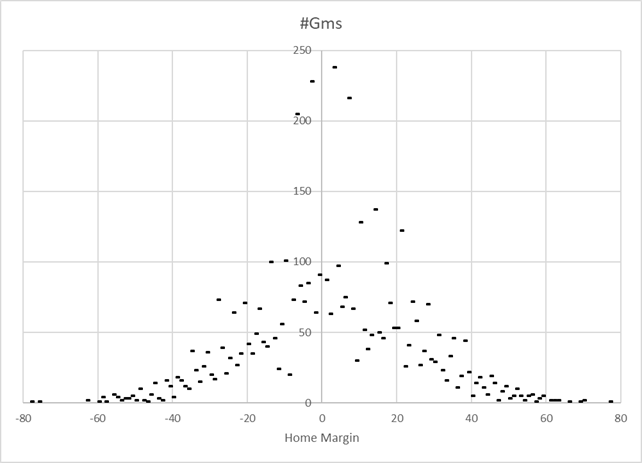
home score − visitor scorewhich for the 4877 such games since 2014 is 2.24.
Early in the season there aren't all that many conference games so for the purposes of calculating an HFA I'll use non-neutral site conference games from the previous season beginning from the equivalent week in that season. Had I done that for the 2018 season, we would've had:
I don't use data from prior seasons for any other factor in my ratings, but it appears justified for the hfa calculation.
Thrudate #g hs-vs Cum hs-hs From To #Gms hs-vs 5-Sep-18 8 -4.13 8 -4.13 6-Sep-17 5-Sep-18 994 2.62 12-Sep-18 13 6.08 21 2.19 13-Sep-17 12-Sep-18 995 2.72 19-Sep-18 21 -1.95 42 0.12 20-Sep-17 19-Sep-18 999 2.60 26-Sep-18 63 4.67 105 2.85 27-Sep-17 26-Sep-18 991 3.02 3-Oct-18 77 1.92 182 2.46 4-Oct-17 3-Oct-18 985 3.08 10-Oct-18 95 0.24 277 1.70 11-Oct-17 10-Oct-18 985 3.11 17-Oct-18 96 1.87 373 1.74 18-Oct-17 17-Oct-18 976 2.67 24-Oct-18 98 1.12 471 1.61 25-Oct-17 24-Oct-18 971 2.64 31-Oct-18 106 3.25 577 1.92 1-Nov-17 31-Oct-18 970 2.91 7-Nov-18 110 2.88 687 2.07 8-Nov-17 7-Nov-18 970 2.96 14-Nov-18 113 1.93 800 2.05 15-Nov-17 14-Nov-18 974 2.94 21-Nov-18 104 1.18 904 1.95 22-Nov-17 21-Nov-18 971 2.14 28-Nov-18 59 0.85 963 1.88 29-Nov-17 28-Nov-18 976 1.98 5-Dec-18 5 2.20 968 1.88 6-Dec-17 5-Dec-18 968 1.88 12-Dec-18 1 5.00 969 1.89 13-Dec-17 12-Dec-18 969 1.89 19-Dec-18 1 23.00 970 1.91 20-Dec-17 19-Dec-18 970 1.91
© Copyright 2019, Paul Kislanko
Football Home