The idea was that instead of 25 ± 2.5 for a game's "worth" or "cost" (the ± being applied to account for home field advantage) I calculated the "Strength of Victory" as defined by the NFL:
to come up with a variable adjustment factor for each game:
SOVgame = winning scoregame − losing scoregame winning scoregame + losing scoregame
to define the "game worth" that is added to the opponents' rating for wins and subtracted for losses at every iteration.
ƒ(game) = SOVgame × (winning score + losing score) SOV 2
There is a serious problem with this approach that I recognized from the beginning but wasn't clever enough to fix. Every shutout counts the same weight whether it's 2-0 or 66-0, and that awful 3-2 game counts the same as a watchable 21-14 game. While reading Keener's paper on how advanced rating systems depend upon the Perron-Frobenius theorem (thanks again to Dr. Massey for bringing that to our attention) I thought of a simple fix.
The whole idea is to adjust the winner's and loser's rating for iteration n based upon their opponent's values for iteration n − 1 and how close to a tie the game result. The first quotient in the game-worth formula was meant to capture the notion of "relationship to a standard game" – how much better or worse than "average" the win was by. Clearly 66-0 is more different from a standard game than 3-0, but the NFL's definition does not distinguish between shutouts.
The insight from Keener's paper was the utility of the mediant. For two rational numbers p⁄q and r⁄s the mediant of the two is
and even though this looks like a grade-schooler's mistaken attempt to add fractions, it is a perfectly respectable way to find a value between p/q and r/s — the mediant is often profitably used in proofs about rational numbers.
p + r q + s
With suitable (fixed for all games) choices for r and s (Keener chose 1 and 2 for one of his formulas) the "comparison to a standard game" can be reformulated in a way that neatly solves the shutout problem. Just replace winning score − losing score (MoV) and winning score + losing score (Total) in the formula with those values plus the averages of those values over all games.
This very neatly eliminates the need to introduce the ad hoc tweaks I had to make to keep SOVgame ÷ SOV within a reasonable range, and distinguishes shutouts by the margin of victory:
ƒ(game) = MoVgame + MoV × Total Totalgame + Total 2
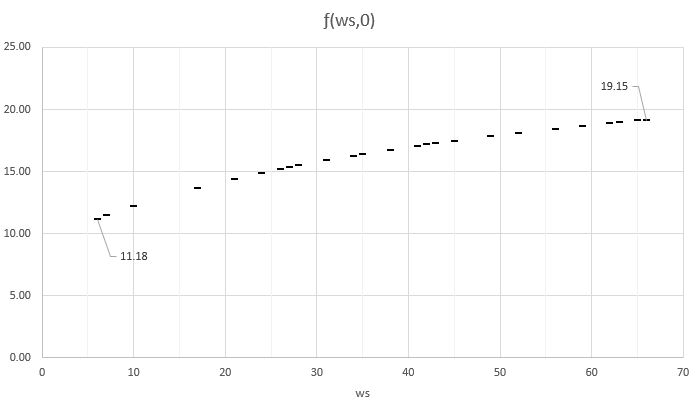
The range of adjustment factors ƒ for all games through 21 October is 3.1-19.2 based upon a standard game (36.59-17.76) with value 9.4 looks like this:
For each MOV value ƒ is smaller for larger total score: the 3.07 represents 71-68 since those teams are more nearly the same than those who play a 3-0 game. We can summarize the values of ƒ by MOV expressed in number of scores: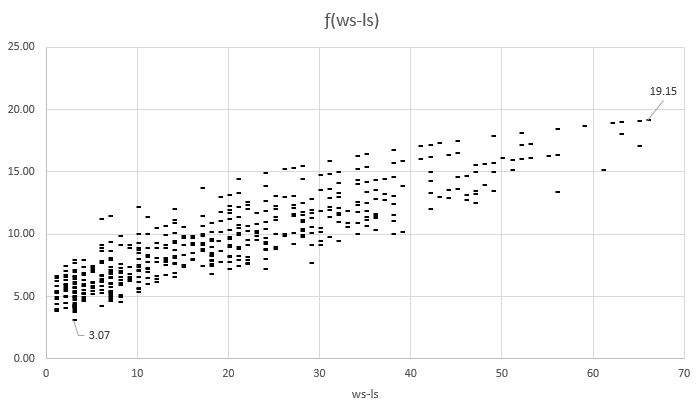
The ♦ at ≈ (2.8, 9.4) represents the average MoV and Total Points.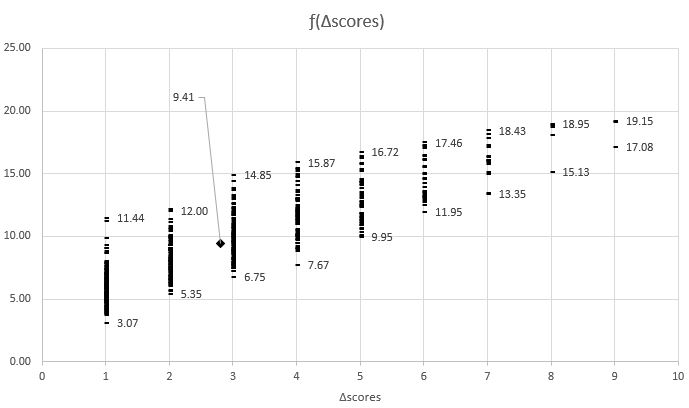
For once instead of just implementing the change and giving the results a "smell test" I finished the above analysis before writing any code. Without knowing how the algorithm would perform with the new ƒ we note that it has very desirable properties compared to the original.
We make a minor tweak to account for a home field advantage (hfa.) In games not at neutral sites use:
with the ambiguous sign taken to be + for a game in which the visitor won and − for a home-team win.
ƒ(game) = MoVgame ± hfa + MoV × Total Totalgame + Total 2
When I plug that ƒ(game) into Boyd's iterative formula, I get results that pass the "smell test." Here's the top 20 (follow the SOV link and its ISOV link to see the full list.)
Rank ISOV Norm Team Conf SOS Rank W SOS(W) L SOS(L) 1 1 118.68 2.277 Penn State B10 105.72 28 28 7 105.72 0 0.00 2 2 118.27 2.228 Alabama SEC 105.05 36 36 8 105.05 0 0.00 3 3 116.32 1.994 Clemson ACC 107.22 9 9 6 107.28 1 106.84 4 4 116.32 1.994 Georgia SEC 104.45 46 46 7 104.45 0 0.00 5 5 116.14 1.973 Notre Dame ND 107.09 11 11 6 105.56 1 116.32 6 6 115.13 1.852 UCF AAC 103.77 61 61 6 103.77 0 0.00 7 7 114.58 1.785 Wisconsin B10 103.50 66 66 7 103.50 0 0.00 8 8 114.42 1.766 Ohio State B10 104.07 57 57 6 102.87 1 111.24 9 9 114.42 1.766 Miami-Florida ACC 105.54 30 30 6 105.54 0 0.00 10 10 114.21 1.741 Virginia Tech ACC 104.28 52 52 6 102.27 1 116.32 11 11 113.91 1.706 TCU B12 102.04 88 87 7 102.04 0 0.00 12 12 113.20 1.621 Michigan State B10 106.98 13 13 6 105.45 1 116.14 13 13 112.99 1.595 Washington P12 102.87 71 71 6 101.93 1 108.52 14 14 112.92 1.587 Oklahoma State B12 104.61 43 43 6 103.06 1 113.91 15 15 112.47 1.533 North Carolina State ACC 105.90 27 27 6 105.58 1 107.80 16 16 111.60 1.428 Michigan B10 107.59 7 7 5 104.25 2 115.94 17 17 111.24 1.385 Oklahoma B12 104.10 55 55 6 103.00 1 110.69 18 18 110.69 1.320 Iowa State B12 105.08 35 35 5 103.65 2 108.63 19 19 110.69 1.319 Washington State P12 102.87 70 70 7 102.34 1 106.58 20 20 110.66 1.316 Stanford P12 105.20 33 33 5 103.63 2 109.12
I will not change the formula mid-year, but I will calculate the new version for the remainder of the season. Unless quantitative analysis shows the new version is not an improvement, I will likely make the change next off-season.
Week Games oldSU %SU newSU %SU2 oldPP %PP newPP %PP2 10 98 72 73.5 72 73.5 47 48.0 57 58.2 11 98 74 75.5 75 76.5 53 54.1 61 62.2 12 99 78 78.8 78 78.8 50 50.5 62 62.6 13 68 50 73.5 49 72.1 35 51.5 41 60.3 14 21 12 57.1 14 66.7 9 42.9 13 61.9 15 5 3 60.0 4 80.0 2 40.0 3 60.0 Bowls 42 29 69.0 31 73.8 21 50.0 29 69.0 431 318 73.8 323 74.9 217 50.3 266 61.7
The updated version usually predicts the same winner as the original, and when it doesn't it usually turns out to pick the winner. When we look at the percentage of games for which the actual margin of victory is greater than or equal to the predicted value, the updated algorithm performs more than 20 percent better. Some of that is just because the new version predicts smaller margins to start with, but they are still more nearly "right" than the original.
Follow the predictions of the original and the revised algoirtithms.
© Copyright 2017, Paul Kislanko
Football Home