Strengths of Schedule

July 6, 2014

When it's time to decide which four teams are the best in 2014 we're going to be asking which "proved the most" by winning against better teams. Here's a pre-season look at how tough it will be for teams to be included in that discussion.

None of the good ways to measure schedule strength will be available until lots of games have been played, so all we have to go on is opponents' ranks, and until the pre-season computer rankings are published all we have is last year's. I am using the value in the Maj column - the best rank for which more than half of the computers have the team ranked that highly.

Ordinal ranks are not an ideal metric - there's a lot more of a difference between #20 and #1 than there is between #70 and #50 that isn't captured with a simple average. For full schedules a reasonably good alternative is to find the rank that characterizes more than half the opponents. For example Arkansas has seven opponents in the top 27, and by any measure has the toughest 1AA schedule. Even that isn't very useful for non-conference schedules with only three or four games.

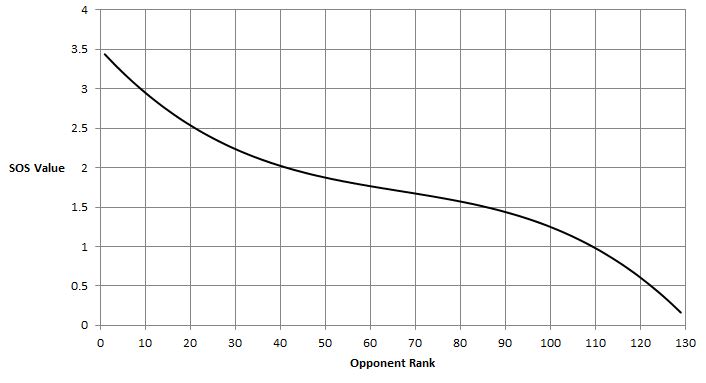
For an average that accounts for the rating non-linearity that is lost when just rankings are available I wanted something that "looks like" the rank-based interest formula but with only the opponent's rank as a variable. I came up with

875000 - 15625×Rank + 200×Rank2 - Rank3

250000
the graph of which is:
SOS Value based upon opponent rank

Based as it is on last year's opponents' rankings, it is no surprise that 19 of the 25 toughest schedules will be played by SEC or Pac 12 teams. Predictably, only two teams from those conferences appear in the top 25 non-conference schedules.

SOS Based Upon Opponents' 2013 Computer Ranks

LY Rank Team Med Avg Rank O-Ranks
83 Arkansas 27 37.5 1 3 5 6 16 19 23 27 33 38 40 114 126
24 Notre Dame 47 41.2 2 1 6 15 19 20 43 47 48 57 60 68 110
49 Utah 36 39.0 3 6 7 13 15 20 28 36 39 43 51 84 126
19 Texas A&M 33 45.3 4 3 5 6 8 16 27 33 57 83 89 90 126
60 Tennessee 33 42.7 5 5 6 8 10 23 27 33 44 61 71 98 126
105 California 36 41.4 6 6 7 13 19 20 28 36 39 51 68 84 126
20 Southern California 39 42.6 7 6 13 15 24 28 36 39 49 51 61 84 105
13 UCLA 31 46.9 8 6 7 15 19 20 28 31 49 84 98 101 105
31 Texas 40 45.5 9 10 10 13 15 29 36 40 55 69 84 86 99
8 South Carolina 47 47.3 10 3 5 12 19 23 33 47 60 61 81 98 126
3 Auburn 29 46.4 11 6 8 16 19 23 27 29 33 75 83 112 126
98 Kentucky 33 47.1 12 5 8 16 19 23 33 33 60 61 90 91 126
61 Florida 33 51.2 13 1 5 6 8 16 23 33 60 98 118 120 126
28 Arizona 51 50.6 14 7 13 15 19 20 49 51 72 80 84 92 105
84 West Virginia 40 49.1 15 6 10 10 15 29 31 40 68 69 86 99 126
23 Georgia 60 51.8 16 3 5 8 12 33 44 60 61 83 89 98 126
51 Washington State 39 49.3 17 6 7 15 19 20 28 39 49 86 92 105 126
98 Virginia 37 45.0 18 1 13 19 30 36 36 37 44 47 52 99 126
15 Arizona State 39 47.3 19 6 13 19 20 24 28 39 49 51 84 108 126
27 Mississippi 54 50.3 20 3 6 16 19 33 33 54 60 70 83 101 126
6 Stanford 39 48.2 21 7 13 15 19 20 24 39 49 51 105 111 126
84 Colorado 39 50.0 22 7 13 15 19 20 28 39 49 74 105 110 121
7 Oregon 49 52.3 23 5 6 13 19 28 39 49 51 84 102 105 126
86 Iowa State 40 50.8 24 10 10 15 29 31 33 40 63 69 84 99 126
15 Oklahoma State 69 54.8 25 1 10 10 29 31 40 69 72 84 86 99 126
Full List

NonConference SOS Based Upon Opponents' 2013 Computer Ranks

LY Rank Team AvgNC Rank NC O-Ranks
89 SMU 38.3 1 10 19 55 69
31 Texas 34.7 2 13 36 55
24 Notre Dame 41.2 3 1 6 15 19 20 43 47 48 57 60 68 110
81 South Alabama 47.0 4 8 33 48 99
20 Southern California 40.3 5 24 36 61
112 Louisiana Tech 52.3 6 3 10 70 126
102 Wyoming 54.8 7 5 7 81 126
90 UL Monroe 54.5 8 16 19 85 98
72 Texas-San Antonio 50.0 9 15 28 49 108
81 Florida Atlantic 61.5 10 6 34 102 104
18 UCF 54.0 11 5 36 49 126
75 San Jose State 55.5 12 3 45 48 126
104 Tulsa 66.5 13 10 74 81 101
47 East Carolina 54.5 14 8 37 47 126
121 Massachusetts 56.8 15 33 49 61 84
54 Boise State 58.5 16 27 36 70 101
64 Indiana 57.8 17 5 45 55 126
15 Oklahoma State 66.3 18 1 72 126
1 Florida State 56.5 19 15 24 61 126
60 Cincinnati 59.0 20 12 36 63 125
101 Memphis 61.0 21 13 27 78 126
12 Ohio State 61.0 22 37 48 60 99
80 UNLV 55.4 23 28 36 38 49 126
57 Rice 66.0 24 19 24 110 111
60 Tennessee 62.8 25 10 44 71 126
Full List

© Copyright 2014, Paul Kislanko