How Much Fun 2012

© Copyright 2012, Paul Kislanko

I've been reporting an interest factor for games for years, but I've refined changed the formula enough times I should've given it version numbers. Last year I wrote:

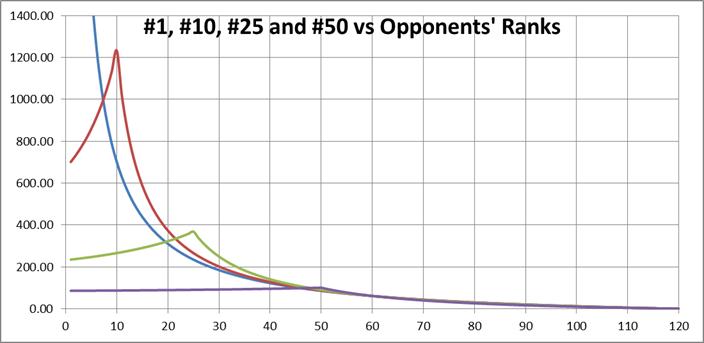
The formula I chose is loosely based upon Potemkin's magnitude of ranking violation metric. It is:
( N + 1 - R1) × ( N + 1 - R2 )

( | R1 - R2 | + max( R1, R2 ) )
N is the number of ranked teams, and R1, R2 are the ordinal ranks of the opponents in each game. We take any game against an unranked team as being of zero interest and assign unranked teams a rank of N + 1
That formula does a good job of distinguishing the "more interesting" from "less interesting" games based upon the computer rankings of the opponents, but its values are difficult to interpret because they vary so widely. You'd really have to form the ratio of two games' "interest factor" to get a relative rating. It would be a lot easier if you could just look at the difference between the numbers.

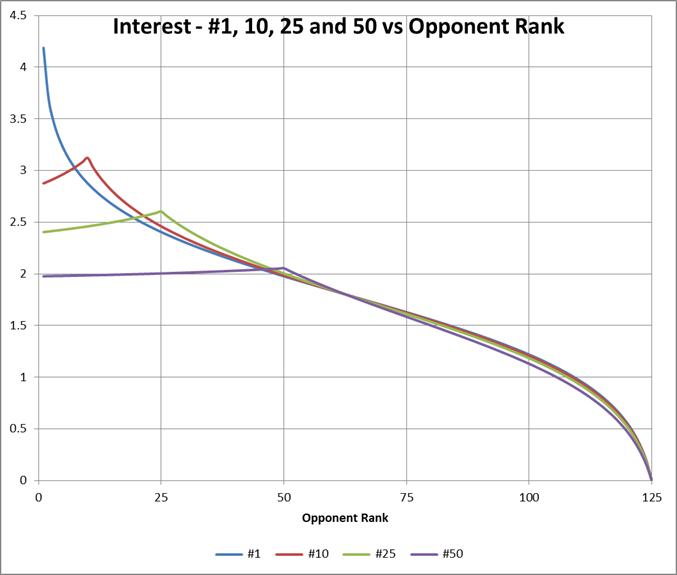
I'm a little embarrassed not to have noticed sooner that the obvious way to turn ratios into differences is to just report the common logarithm:

Log10[( N + 1 - R1) × ( N + 1 - R2 ) + 1 ]

{ 2 × max( R1, R2 ) - min( R1, R2 ) }
The denominators are the same ( | R1 - R2 | is max( R1, R2 ) - min( R1, R2 ) ). The +1 just keeps what was zero, zero.

Compare last year's graph with the #1 curve "off the scale" to

#1,10,25,50 vs Opp rank

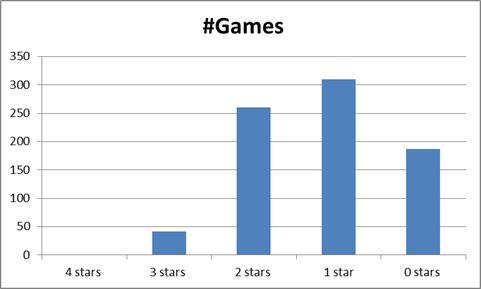
The maximum "interest" value for a game as a function of a team's rank is just a plot of the peaks of those curves calculated for every rank:

maximum interest value vs better team rank

#Games Pct cumPct
4 stars 1 0.1 0.1
3 stars 41 5.1 5.3
2 stars 260 32.5 37.8
1 star 310 38.8 76.6
0 stars 187 23.4 100
Just changing the scale by taking the logarithm of the interest function makes it easy to rate games in the ubiquitous "star" system. If the interest factor for a game is greater than 3.5, give the game four stars. If less than that but greater than 2.5, give it three stars. Two stars for interest less than 2.5 but greater than 1.5, one star for interest factors greater than 0.5 but less than or equal to 1.5, and no stars for games with interest factors less than or equal to 0.5.
interest histogram
It goes without saying (but I will anyway) that these data support the notion that the FBS schedules are (ahem) "not all that great."

Now, it hardly bears calculating the average interest-factor by team-schedule (but you know I did anyway) because that pretty much tracks the team's rank. But there's a way to slice the interest factor surface that sheds some light on an old topic.

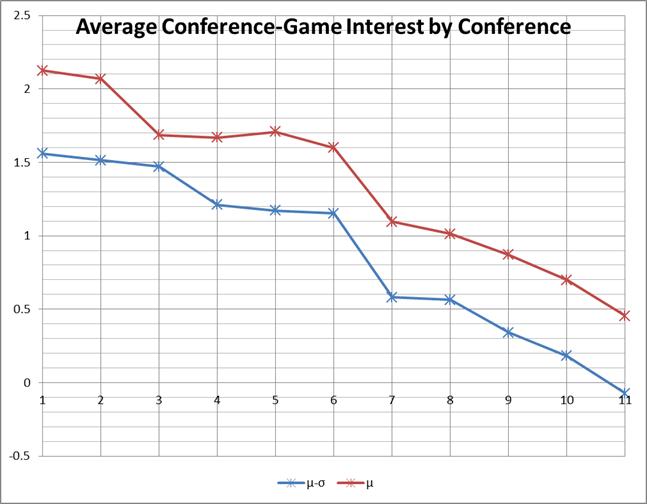
It is often posited that teams from the power conferences do not need to play (can get away without playing) strong OOC opponents because their conference schedule is so tough. We can test that hypothesis by applying the interest factor to only conference games.

μ-σ Conf AvgInt Std Dev #Tms #Gms 4Star 3Star 2Star 1Star noStar
1.5590 B12 2.1244 0.5654 10 45     19 17 9  
1.5132 SEC 2.0685 0.5554 14 56   1 8 39 8  
1.4706 BigE 1.6861 0.2155 8 28       24 4  
1.2119 P12 1.6681 0.4562 12 54     3 26 25  
1.1714 B10 1.7074 0.5360 12 48     5 27 16  
1.1511 ACC 1.5989 0.4478 12 48     2 23 23  
0.5814 CUSA 1.0951 0.5137 12 48       7 33 8
0.5623 MW 1.0127 0.4504 10 40       9 26 5
0.3414 MAC 0.8700 0.5285 13 52       3 35 14
0.1822 SBC 0.6982 0.5160 10 40       5 19 16
-0.0741 WAC 0.4542 0.5283 7 21       1 8 12

I ordered the conferences by average interest factor minus the standard deviation to account for conferences that have dominant teams much better than the conference's average or really weak teams much worse than the conference average. It turns out to be almost the same sequence as just the average, with a narrower range of values. The exception is the B1G, which drops below the Pac 12 and Big East when sorted this way.

conference race interest

All of these are, of course, still based upon 2011 team-ranks. I'll revisit the subject when 2012 results-based computer rankings become useful. Meanwhile, here are the two-stars and above games for the first weekend.

ValueGame
⇑⇑⇑2.81#13 Boise St at # 16 Michigan StFriday 31 Aug
⇑⇑⇑2.79#1 Alabama vs # 12 Michigan (Arlington TX)Saturday 1 Sep
⇑⇑2.45#30 Auburn vs # 27 Clemson (Atlanta GA)Saturday 1 Sep
⇑⇑2.36#32 Southern Miss at # 22 NebraskaSaturday 1 Sep
⇑⇑2.18#44 North Carolina St vs # 44 Tennessee (Atlanta GA)Friday 31 Aug
⇑⇑2.13#43 Georgia Tech at # 23 Virginia TechMonday 3 Sep
⇑⇑2.05#50 Iowa vs # 50 Northern Illinois (Chicago IL)Saturday 1 Sep
⇑⇑1.99#13 South Carolina at # 50 VanderbiltThursday 30 Aug
⇑⇑1.94#54 Louisiana Tech vs # 24 Texas A&M (Shreveport LA)Thursday 30 Aug
⇑⇑1.86#59 Nevada at # 41 CaliforniaSaturday 1 Sep
⇑⇑1.86#41 Tulsa at # 59 Iowa StSaturday 1 Sep
⇑⇑1.81#62 Ohio U. at # 39 Penn StateSaturday 1 Sep
⇑⇑1.75#66 SMU at # 21 BaylorSunday 2 Sep
⇑⇑1.72#67 San Diego St at # 46 WashingtonSaturday 1 Sep
⇑⇑1.71#50 Miami FL at # 68 Boston CollegeSaturday 1 Sep
⇑⇑1.70#54 Toledo at # 68 ArizonaSaturday 1 Sep
⇑⇑1.68#71 Arkansas St at # 5 OregonSaturday 1 Sep
⇑⇑1.59#75 Kentucky at # 45 LouisvilleSunday 2 Sep
⇑⇑1.58#75 Western Michigan at # 56 IllinoisSaturday 1 Sep
⇑⇑1.54#80 Navy vs # 24 Notre Dame ( Dublin Ireland)Saturday 1 Sep
⇑⇑1.52#81 Marshall at # 21 West VirginiaSaturday 1 Sep
1.50#82 Washington St at # 32 Brigham YoungThursday 30 Aug
1.50#83 Wyoming at # 19 TexasSaturday 1 Sep
1.48#66 Northwestern at # 79 SyracuseSaturday 1 Sep
1.37#90 Miami OH at # 29 Ohio StateSaturday 1 Sep
1.34#92 Bowling Green at # 24 FloridaSaturday 1 Sep
1.31#95 San Jose State at # 8 StanfordFriday 31 Aug
1.31#78 Florida Int'l at # 86 DukeSaturday 1 Sep
1.31#95 Hawai'i at # 5 Southern CalSaturday 1 Sep
1.29#6 Oklahoma at # 96 UTEPSaturday 1 Sep
1.20#101 North Texas at # 2 LSUSaturday 1 Sep
1.09#63 UCLA at # 100 RiceThursday 30 Aug
0.95#110 Buffalo at # 16 GeorgiaSaturday 1 Sep
0.91#100 Eastern Michigan at # 95 Ball StThursday 30 Aug
0.67#94 Colorado vs # 110 Colorado St (Denver CO)Saturday 1 Sep
0.65#41 Rutgers at # 117 TulaneSaturday 1 Sep
0.56#87 Minnesota at # 115 UNLVThursday 30 Aug
0.54#118 Massachusetts at # 64 ConnecticutThursday 30 Aug
0.53#107 Troy at # 110 Alabama-BirminghamSaturday 1 Sep
0.53#120 Texas St-San Marcos at # 20 HoustonSaturday 1 Sep
0.21#71 Central Florida at # 123 AkronThursday 30 Aug
0.08#121 Texas-San Antonio at # 119 South AlabamaThursday 30 Aug

Stop me if you've heard this before, but something needs to be done about FBS scheduling.