Every "advanced" rating system uses every path in the games graph to form an objective team ranking. Every team in the FBS is connected to every other team in FBS by an A↔B↔... chain of no mor than 4 ↔s. But there is a qualitative difference in the way some teams are treated. Every "advanced" method will take into account A↔B1↔B2 with the same weight as A↔Bi↔C and A↔B1↔C1↔B2↔A the same as A↔B↔C↔D↔E.
The new metric is:
|
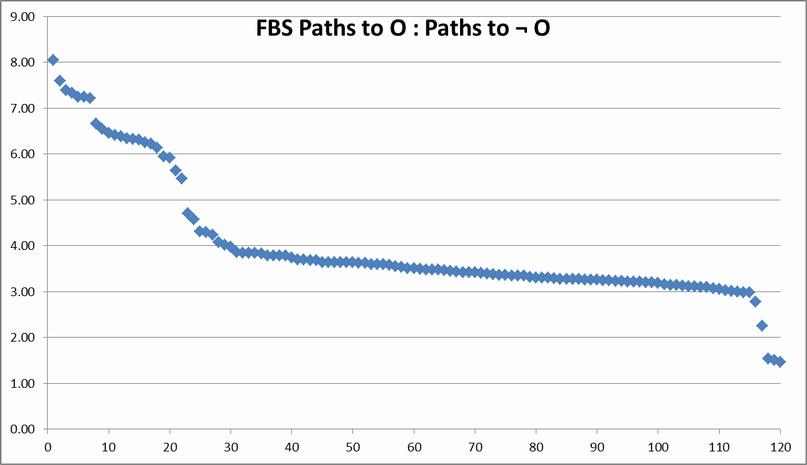
The higher this number, the less-connected is the team. Since advanced ratings use at least all the paths up to the games graph diameter (most use them more than once) here's what that measure looks like for λ=4:
84 of the 120 FBS teams have values between 3 and 4, and three more teams are in that range ±0.02 units. The most-connected teams are the FBS Independents - especially the Acadamies play the most geographically diverse schedules in the field. The least-connected? The 22 teams in the Pac 12 and Big 12.
The 9-game conference schedules those conferences play just do not allow enough scheduling opportunities. A consequence of the "knots" in the games graph these extreme teams form is that advanced ratings that treat each game ("edge" in the games graph) equally wind up using qualitatively different formulas for these teams than for teams with "normal" connectivity. Roughly, the opponents' winning percentage counts twice as much relative to the rest of the field.
Aside: Although I used opponents' winning percentage as an example, the same consideration applies regardless of the advanced ratings' components. As long as each edge of the games graph (game) is treated equally, the the effective algorithm varies with the "local topology" for a specific team compared to the "global."
Playing an extra conference game isn't the only reason a team might be less connected to the FBS field. In 2011 93 FBS teams played 97 games against 77 FCS teams. (76 of the 246 Division 1 teams played only opponents from the same subdivision.)
Performing the same calculation for all of D1 (for which the games graph diameter is 6) and ranking them 1 (least-connected) to 246 (most-connected) we get
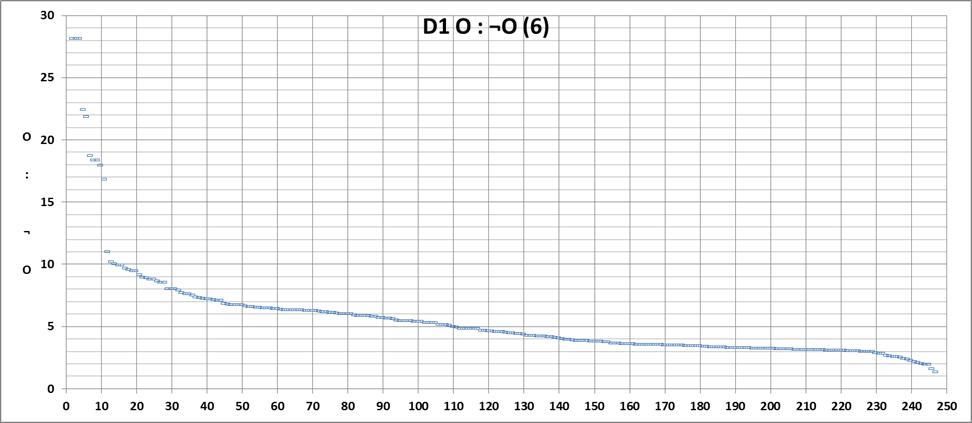
Looking at just the FBS teams' ranks we see they fall into two distinct groups:
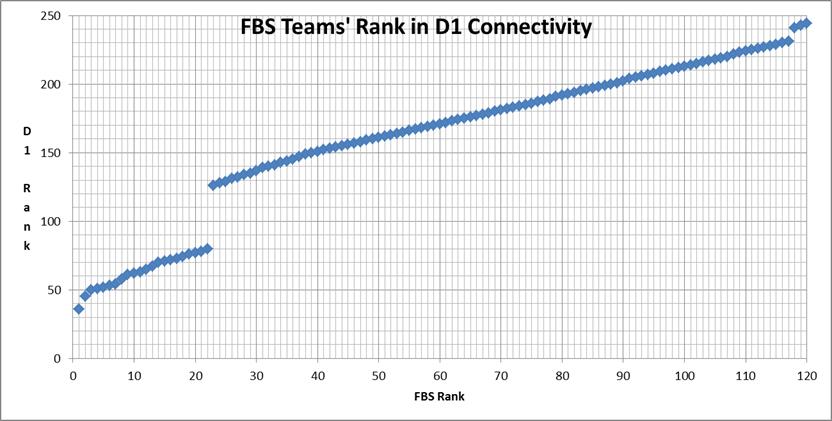
Another source of variation in algorithms is the field definition itself. To form the above graph, I first ranked the entire D1 field and then ordered the FBS teams 1-120 based upon their relative position in the entire list. But this is not the same order they were in when only FBS games were used.
What this illustrates is that the same rating usually will give a different ordering of FBS teams if all D1 games are used to form it than if only games involving FBS opponents are used. This can be important - the RPI (which is not an "advanced" system) picks a different #2 if all D1 games are used than it does when only FBS games are considered.
Note that the problem is not just that teams are disconnected. If all teams were equally as disconnected (by being very much more connected to a small subset of the field) our advanced ratings would not have much difficulty using the connectors to rate the separate "islands" as a group and then compare groups (this was the case in D1 baseball prior to the early 2000s.) Or, for weakly-connected fields like FCS, D2 and D3 you could rely on a post-season tournament to compare teams from the well-connected subfields.
In short, it is bad for us analysts and the people who depend upon our rankings for anything important when:
The BCS is a coalition of conferences and bowls whose rules are based upon consensus. But were there a King/Queen of BCS who could dictate requirements, I'd recommend he/she require participating conferences to:
Nobody cares that the current trends make the ratings harder to get right because everybody likes to complain about the ratings when they don't like the ranks, and everybody likes to cite them when the errors in them benefit their team.
Those of us who produce them just wish everybody who complains or cites knew more about them than whether they "agree" with them or not!
| FBS | O : ¬ O4 for FBS |
| D1 | O : ¬ O6 for D1 = {FBS ∪ FCS} |
Above I chose λ=4 for FBS (6 for D1) and graphed
| average # (paths to opponents+paths to self) |
| average # paths to non-opponents |
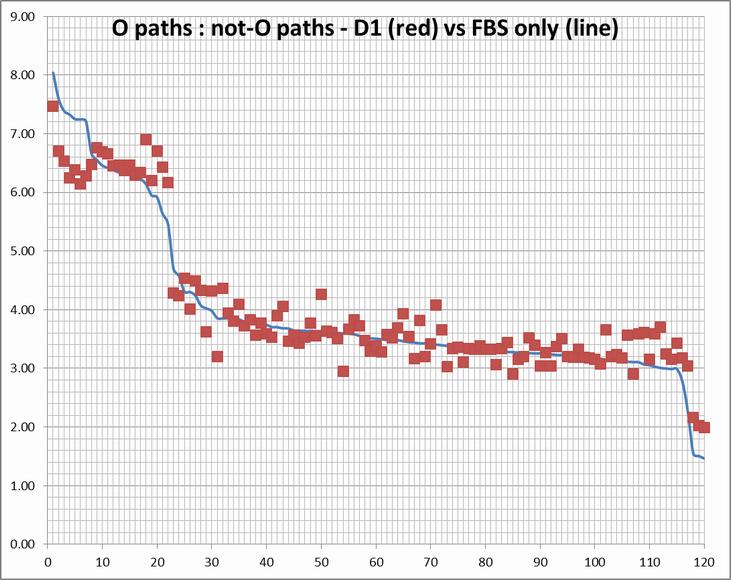
Here's what that looks like for λ=2, 3 and 4 for the FBS field.
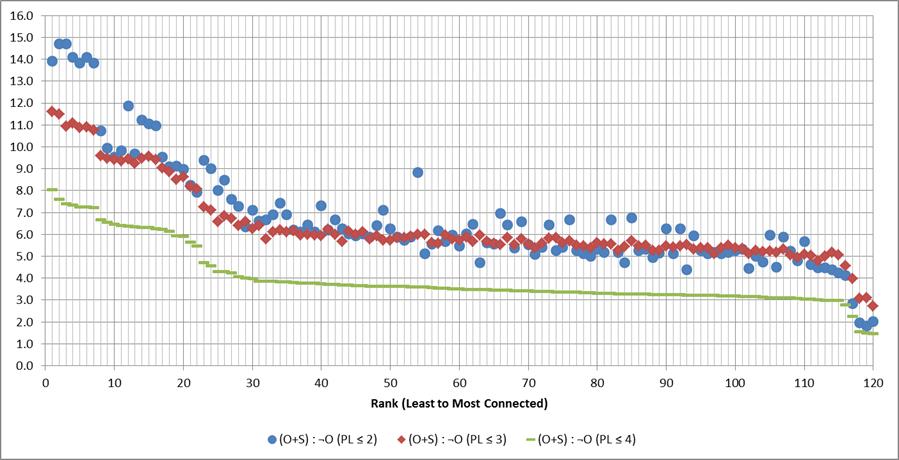
λ=4 is the games-graph diameter, but as I noted above advanced systems' results will usually depend upon some (much) larger value of λ. The same pattern persists with higher λ values as can be seen from by this graph of the changes as λ varies from 4 to 8:
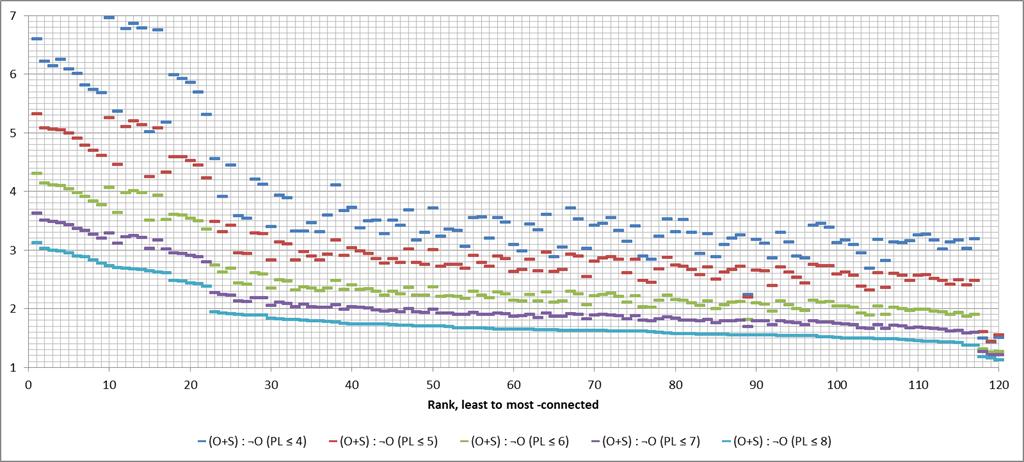
The range of (S+O)paths÷¬O paths gets smaller as λ gets larger, but the pattern stays the same: there is a qualitative difference in the rating functions for teams that are relatively less (or more, though that involves fewer teams) -connected than the teams for which the values fall within the "linear" range in the graphs.