Rating Games

© Copyright 2007, Paul Kislanko

18 August, 2007
In an era when almost every Football Bowl Subdivision game of interest is available on television, a common theme for columnists and bloggers is to rank the upcoming games. In the pre-season, we see columns such as "Top 25 Conference Games", "Best Interconference Matchups", and so forth. During the year there's a weekly list by conference and/or national impact by almost everybody.

It occurs to me to define an objective measurement of the "interest factor" based upon the teams' ranks and their difference. If the opposing teams' ranks are R1 and R2 and N is the total number of teams (120 this year):
Interest = (N - R1) × (N - R2)

( | R1 - R2 | + MAX (R1, R2) )

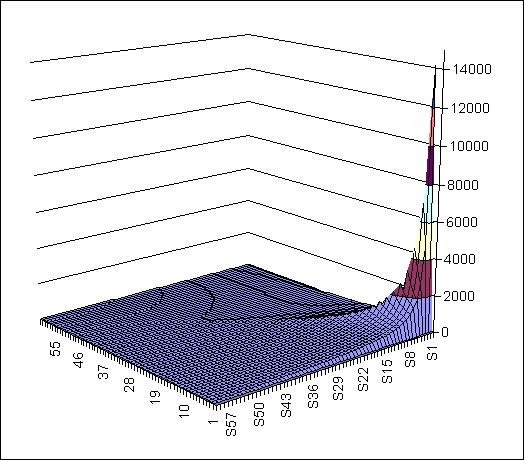
This value ranges from zero (any game involving the lowest-ranked team) to 14161 when #1 plays #1. Games between top 25 teams will have a value greater than about 230, and games between teams ranked in the top half of the field a value greater than 60.

Interest Factor for R1=1 to 60, R2=1 to 60

Interest values for top 60 vs top 60
(Sn is the label for R2=n)

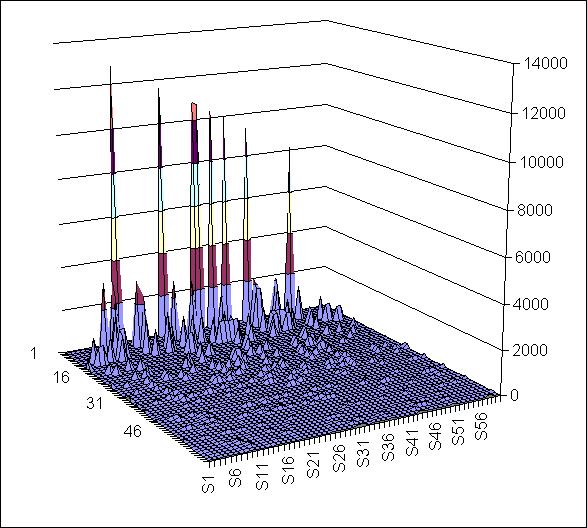
Of course, not every combination of ranks occurs in practice. For 2007, the "interest factor" for top-60 vs top-60 games can be graphed this way:

Interest factors for scheduled games

It only remains to define the ranking that's suitable for this process. The polls aren't useful, since they don't rank every team. I use Kenneth Massey's Rating Comparison (without the human polls) but not the overall ranking he defines as the average rank. Instead, I use the Majority Consensus, (see the Maj column, which is approximately the median rank.) The ranking used is the one that is the best for which 50 percent plus one of the computer rankings are as good. Hence there can be (and are) multiple teams with the same rank.

Top 50 Games - 2007 Pre-Season Rankings
18 Aug 2007 12:49pm (Central)

Week Interest Game Day Loc (if neut or semi-neut)
11 1369.0 # 9 Michigan @ # 9 Wisconsin    
10 1140.3 # 9 Wisconsin @ # 7 Ohio State    
12 1140.3 # 7 Ohio State @ # 9 Michigan    
6 1110.0 # 9 Oklahoma vs # 10 Texas   Dallas TX
6 1082.7 # 8 Florida @ # 4 LSU    
11 843.3 # 5 Louisville @ # 10 West Virginia (Thursday)  
2 797.5 # 10 Virginia Tech @ # 4 LSU    
11 558.8 # 1 Southern California @ # 12 California    
5 534.5 # 15 Auburn @ # 8 Florida    
9 520.0 # 10 West Virginia @ # 16 Rutgers    
11 515.1 # 19 TCU @ # 18 BYU (Thursday)  
8 468.5 # 15 Auburn @ # 4 LSU    
14 443.0 # 16 Rutgers @ # 5 Louisville (Thursday)  
5 436.5 # 22 UCLA @ # 22 Oregon St    
11 409.1 # 23 Arkansas @ # 23 Tennessee    
2 396.8 # 19 TCU @ # 10 Texas    
9 396.8 # 19 Boston College @ # 10 Virginia Tech (Thursday)  
2 384.5 # 18 BYU @ # 22 UCLA    
4 358.1 # 20 Penn State @ # 9 Michigan    
7 358.1 # 9 Wisconsin @ # 20 Penn State    
9 342.4 # 7 Ohio State @ # 20 Penn State    
6 341.3 # 25 Georgia @ # 23 Tennessee    
7 330.8 # 22 Oregon St @ # 12 California    
8 330.8 # 12 California @ # 22 UCLA    
7 328.5 # 15 Auburn @ # 23 Arkansas    
Week Interest Game Day Loc (if neut or semi-neut)
1 308.1 # 23 Tennessee @ # 12 California    
2 304.7 # 27 South Carolina @ # 25 Georgia    
9 291.0 # 27 South Carolina @ # 23 Tennessee    
10 291.0 # 27 South Carolina @ # 23 Arkansas    
3 285.9 # 23 Tennessee @ # 8 Florida    
11 285.0 # 15 Auburn @ # 25 Georgia    
10 271.2 # 22 Oregon St @ # 1 Southern California    
14 271.2 # 22 UCLA @ # 1 Southern California    
13 267.9 # 23 Arkansas @ # 4 LSU (Friday)  
2 258.8 # 30 Nebraska @ # 28 Wake Forest    
13 255.6 # 20 Boise St @ # 28 Hawaii (Friday)  
9 253.3 # 25 Georgia vs # 8 Florida   Jacksonville FL
1 251.1 # 28 Wake Forest @ # 19 Boston College    
8 250.3 # 31 Texas A&M @ # 30 Nebraska    
6 247.7 # 29 Notre Dame @ # 22 UCLA    
2 239.5 # 29 Notre Dame @ # 20 Penn State    
7 235.7 # 19 Boston College @ # 29 Notre Dame    
1 228.8 # 32 Georgia Tech @ # 29 Notre Dame    
11 226.4 # 8 Florida @ # 27 South Carolina    
7 224.9 # 32 Florida St @ # 28 Wake Forest (Thursday)  
4 215.8 # 27 South Carolina @ # 4 LSU    
13 214.4 # 25 Georgia @ # 32 Georgia Tech    
1 210.2 # 32 Florida St @ # 34 Clemson (Monday)  
5 210.2 # 34 Clemson @ # 32 Georgia Tech    
3 206.1 # 29 Notre Dame @ # 9 Michigan    

Other Uses?

There really is nothing interesting in this list since it will be different even before the first games render pre-season rankings ridiculous, because more computer ratings will be added before week 1. Nevertheless, once we've assigned an "interest value" to each game, we can combine games any number of ways. For instance, for each team we can average the IV for each of its games to get the 25 most interesting schedules:
ix Total Avg Rank Team Conf C-Int C-Avg -Rnk NC-Int NC-Avg -Rnk
1 3513.7 319.43 9 Michigan B10 3133.5 391.68 2   380.3 126.75 8
2 3265.0 296.82 9 Wisconsin B10 3136.5 392.06 1   128.5 42.84 47
3 2975.2 270.48 7 Ohio State B10 2888.9 361.11 3   86.4 28.79 59
4 3145.9 262.16 4 LSU SEC 2310.8 288.85 5   835.1 208.77 3
5 2799.8 233.32 8 Florida SEC 2576.2 322.02 4   223.6 55.90 37
6 2430.4 202.54 22 UCLA P10 1675.0 186.11 17   755.5 251.82 2
7 2272.1 189.34 10 Texas B12 1820.2 227.52 8   452.0 112.99 14
8 2073.8 188.53 15 Auburn SEC 1816.0 227.00 9   257.8 85.94 22
9 1989.2 180.84 10 Virginia Tech ACC 1109.4 138.68 23   879.8 293.26 1
10 1982.5 180.23 5 Louisville BigE 1697.7 242.53 7   284.8 71.20 29
11 2156.6 179.71 12 California P10 1815.7 201.74 12   340.9 113.63 12
12 1901.9 172.90 22 Oregon St P10 1675.0 186.11 18   226.9 113.45 13
13 2065.5 172.13 23 Tennessee SEC 1624.8 203.10 11   440.8 110.19 15
14 2054.2 171.19 10 West Virginia BigE 1783.1 254.73 6   271.1 54.22 38
15 2040.9 170.07 1 Southern California P10 1665.1 185.01 19   375.8 125.26 9
16 1858.1 168.91 25 Georgia SEC 1492.1 186.51 16   365.9 121.98 10
17 1747.1 158.83 27 South Carolina SEC 1525.3 190.67 15   221.8 73.92 27
18 1898.8 158.24 9 Oklahoma B12 1721.0 215.12 10   177.9 44.47 45
19 1711.4 155.58 19 Boston College ACC 1459.1 182.38 20   252.3 84.10 23
20 1624.8 147.71 23 Arkansas SEC 1588.6 198.58 14   36.2 12.05 92
21 1579.4 143.59 16 Rutgers BigE 1394.9 199.27 13   184.5 46.14 42
22 1606.1 133.85 29 Notre Dame ND         1606.1 133.85 7
23 1600.7 133.39 20 Penn State B10 1357.4 169.68 21   243.2 60.81 33
24 1409.3 128.12 18 BYU MW 796.7 99.59 35   612.6 204.19 4
25 1404.7 127.70 34 Clemson ACC 1099.9 137.49 24   304.8 101.60 18

Since the formula combines ranking difference with how high the rankings are, a more interesting summary of games might be conference games for each conference. So, we rate the conference schedules by interest value of conference games as follows:
Conf Total Average
1 Southeastern 7542.7 157.14
2 Big Ten 6457.8 146.77
3 Big East 3562.2 127.22
4 Pac 10 5627.0 125.05
5 Big XII 4428.5 92.26
6 Atlantic Coast 4221.0 87.94
7 Mountain West 1415.3 39.31
8 Western Athletic 763.1 21.20
10 Conference USA 719.7 14.99
11 Mid American 451.0 9.20
12 Sun Belt 129.9 4.64

There's no reason to think this way of measuring conference schedules provides any more insight than any other method, but it's pretty easy to implement, and laziness, not necessity, is the mother of invention. So I'll use it this year to provide a "games of the week" list using the updated ratings.