If it seems to you that the non-major conferences (those without automatic bids to BCS bowls) are having a better year than usual, it's not an illusion. Through week three the non-autobid conferences have 14 wins over teams from the Big Six conferences.
Alas, that's still less than a 22 percent winning percentage, and the average score is still 33-17 in favor of the big guys. Nonetheless there has been an improvement in the competitive landscape.
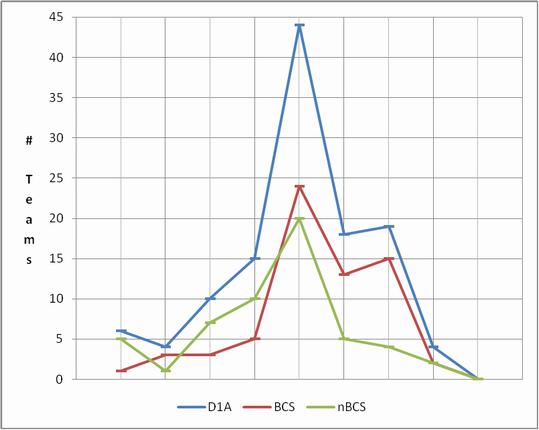
The really good news is that the middle of the packs are more nearly equal. It's too early for my ratings to be useful for comparing a specific team-pair, but because of the calculation method their values have a normal distribution. When we plot the number of teams within ½ standard deviation of the mean and those within buckets ±½ standard deviation farther from it, we get:
Same as always, more of the "better than average" FBS teams are from the autobid conferences, and more of the "worse than average" teams aren't. But the number of teams in the "average" bucket (mean±½standard deviation) is identical when expressed as a percentatge of teams in the category:
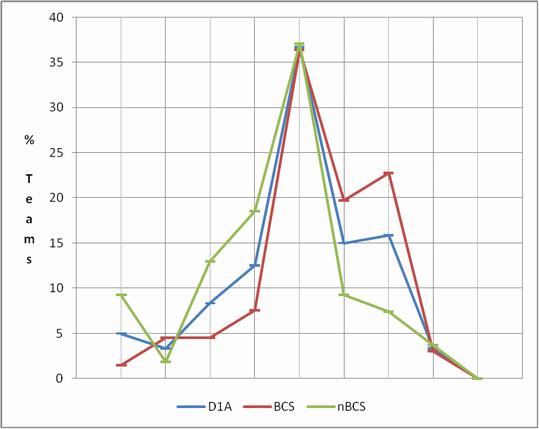
This is a good thing for us fans. There aren't that many games between teams on the right (top) side of the tail, and we don't care all that much about games between teams on the top vs teams on the bottom, but having lots of games between teams in the middle is overall a good thing.