I'm sure the first person was dimly remembering (and mis-stating) a factoid from a statistics class that fulfilled her math requirement in college, but could not bring herself to express that as "if a measurement applied to a population is normally distributed then approximately two thirds of the measurements are within one standard deviation from the mean." Garrison, of course, knows how his statement can be true.
These quotations come to mind as we attempt to understand the 2007 college football season. For many pundits it has been a "down year" because there's not been any major-conference teams who managed to win all their games. "Parity" they proclaim, is the order of the day. Analysis would suggest a better interpretion is that scheduling coincidences resulted in the records we saw - in 2006 would there have been any undefeated teams if Ohio State had played Florida in the regular season?
To compare one season to another we need an absolute metric and a relative characterization of the teams by that metric from one year to another.
If that sounds complicated, recall that is exactly what is meant by "grading on the curve." If last year the average grade on the same test was 75, and this year it was 70, we can say that this year's class didn't do as well as last year's, but if the top grade last year was 90 and there were two students this year who did as well or better, we could say that the top students were better this year.
|
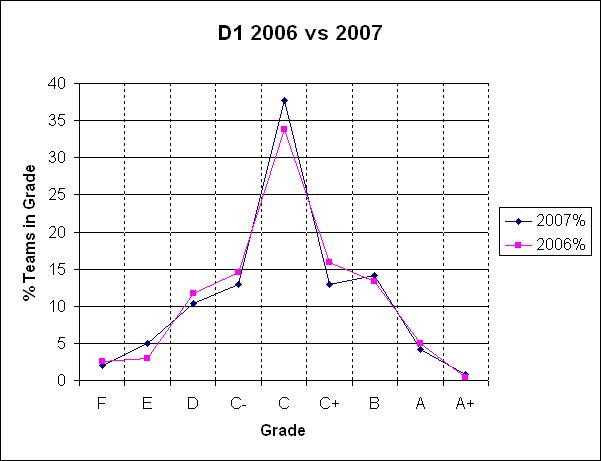
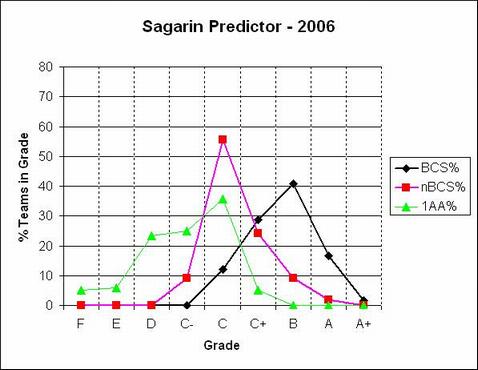
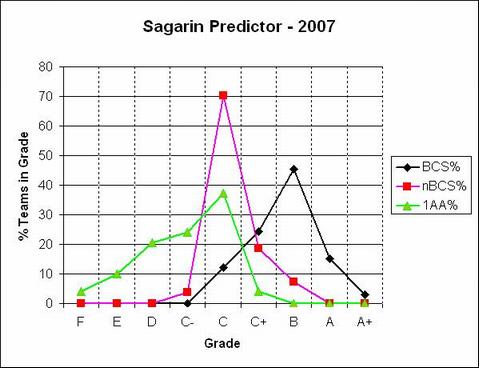
"Average of what?" would be a fair question. In the graphs below I used the Sagarin Predictor, primarily because it is the only metric for which I have comparable ratings from the same period in 2006 and 2007.
Similar results are obtained using less-well-recognized metrics, and in any case it is the method of comparison that is illustrated.
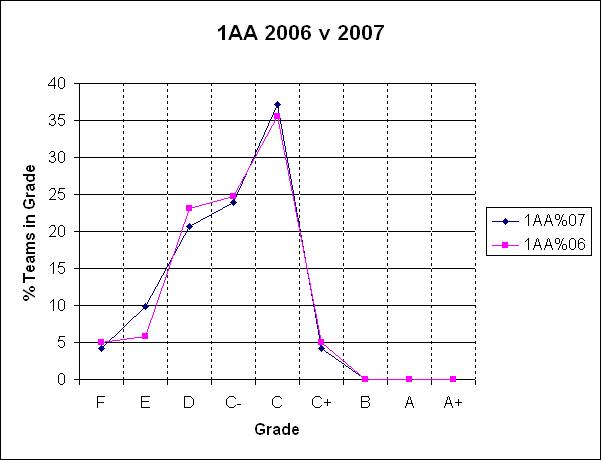
Despite the media splash made by Appalachian State's win to open the season, there are more FCS teams in the E category than last year, and fewer in the C+, but more in the C.
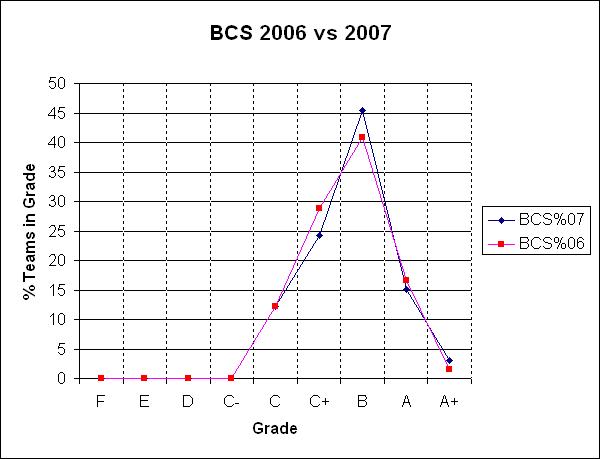
The BCS autobid conference teams are the children who are all above average. Or mostly all.
|
|
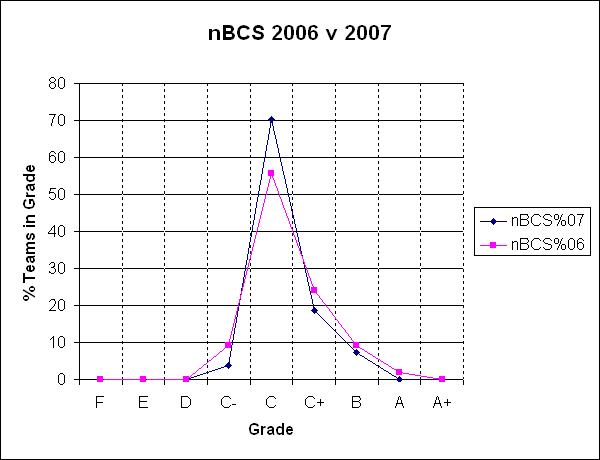
It's not "parity", per se. The best of division 1 teams includes the teams in autobid conferences that are all getting better compared to the rest of the field, and relative to the field the non-autobid conference teams are not getting better. So-called "parity" is just good teams playing more good teams rather than not-so-good teams. (I strongly suspect that had the schedules been similar, those "dominant" teams in previous years wouldn't have been...)
An interesting counter-argument to the "BCS is unfair" argument is that if all of Division 1 had a playoff consisting of the 16 best teams selected the same way that they do it in D2 and D3 there would be no 1AA or non-BCS teams in this year's playoff. Be careful what you ask for...