2016 Schedules

July 4, 2016

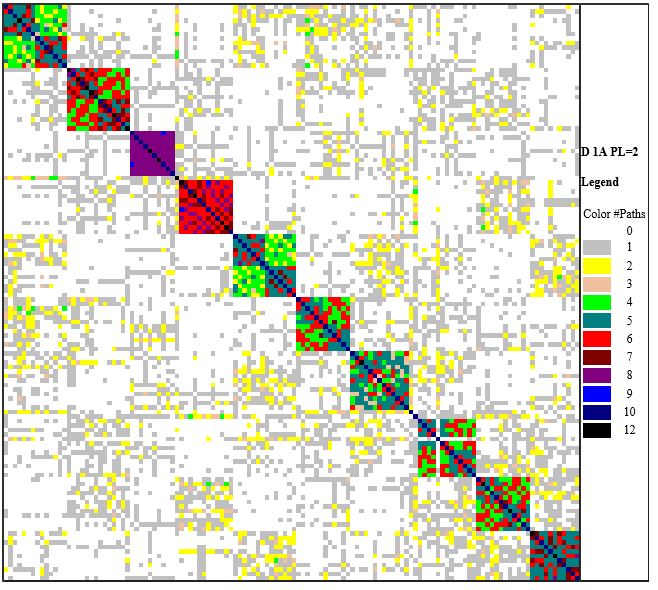
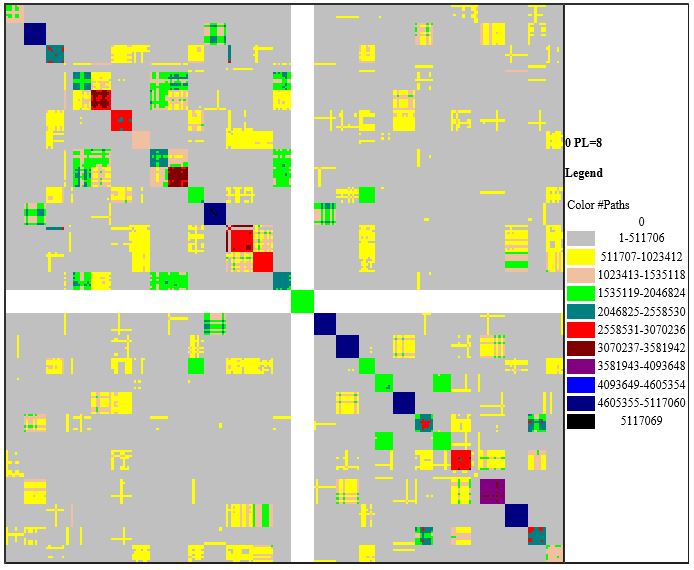
There's nothing to be gained by the annual rant, but the 1A schedules continue to become worse every year from the analyst's (or fan's) perspective. In 2016 only 43.44 per cent of the 8,256 team-pairs will be connected by no worse than an opponents'-opponent relationship. Here's what that looks like in terms of the adjacency matrix (color indicates the number of paths of length two at the end of the season.)

PL=2 for 1A Adjacency Matrix

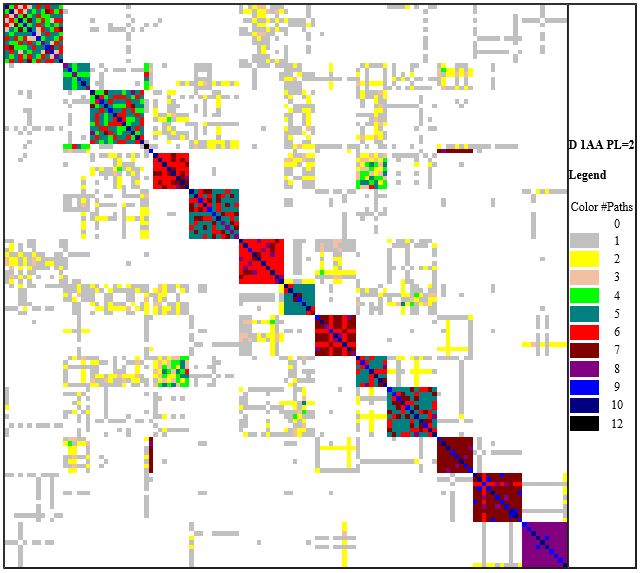
Each square cell represents the row-team, column-team pair. The teams are listed by conference in the same order top to bottom and left to right as the standings page. Division 1AA is still much worse (24.31 per cent) but with its robust playoff (more playoff spots than conferences) that matters less than it does in 1A.

PL=2 for 1AA Adjacency Matrix

An interesting consequence of the continuing increase in 1A-1AA matchups is that it actually serves to make 1AA more connected at the expense of 1A connectivity. Since 1A and 1AA are nearly the same size (128 and 125 teams respectively) the same graphic for all of division one displays distinct quadrants. Imagine how much more "accurate" our analyses would be if the first quadrant were replaced with connections in the second, and the third with connections in the fourth.
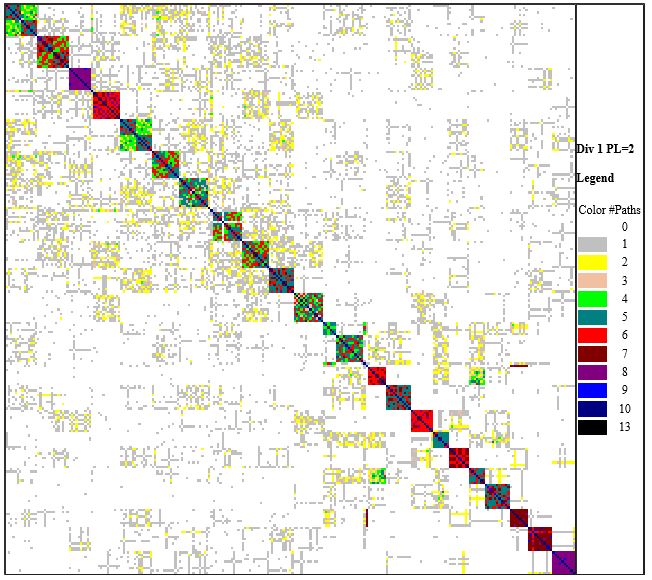
PL2 for D1 Adjacency Matrix

Sigh.

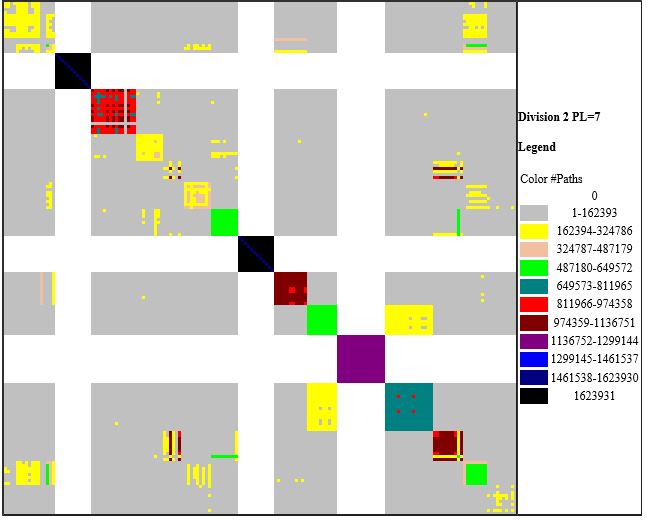
Division Two is farthest along in the "NFL-ization" of college football. There are 171 D2 teams but the 12-team Great American and Mid-America Intercollegiate Athletic conferences along with the 16-team Northern Sun Intercollegiate conferences have no interconference opponents. That leaves the division about the same size as 1A and 1AA, but it takes paths seven steps long to connect the 131 teams, compared to six for the 125 1AA teams and four for the 1A teams.

Division 2 Connectivity at PathLength 7
For completeness, the much larger Division Three requires eight steps to connect the 238 teams that are not members of the New England Small College Athletic Association. The NESCAA teams play no non-conference games, but they also do not contend for the championship so their schedules have no impact on the D3 field.
D3 connectivity at PL=8

Of more interest to the fans is how the intra-subdivision nonconference games are distributed. The "Big 5 Conferences + Notre Dame" have 196 non-conference scheduling opportunities, and only 38 between two such teams (including the five Notre Dame vs ACC team games.) They play 104 games against the other half of 1A (no complaint there - the "non-AQ" conference teams complain if they don't get to play teams from the Power 5) and 52 games against 1AA opponents. Before they relaxed the rules about counting 1AA wins for bowl-eligibility there would have been about 39 more games in the intra-1A schedule and it would be fair to assume that would've meant more interconference matchups involving two "Power 5" teams.

Division 1 Interconference Game Counts

Home→
↓Road
ACCB10B12NDP12SECAACCUSAINDMACMWSBC1AA↓RoadTot#Tms
ACC313 (+1)12 (+3)5100 (+1)010ACC17 (+5)14
B1011110 (+1)1200000B107 (+1)14
B1201030310 (+1)0000B128 (+1)10
ND1 (+1)01100 (+1)00 (+1)0000ND3 (+3)1
P1203011 (+1)011 (+1)03 (+2)00P1210 (+4)12
SEC4 (+3)0 (+1)200 (+1)0110 (+1)000 (+1)SEC8 (+7)14
AAC4410 (+1)0220 (+1)1210AAC17 (+2)12
CUSA403018123 (+1)110CUSA24 (+1)13
IND210 (+1)0 (+1)1 (+1)02 (+1)11100IND9 (+4)2
MAC2 (+1)72005 (+1)34 (+1)2330MAC31 (+3)13
MW06114 (+2)0102430MW22 (+2)12
SBC2110210120340SBC2611
1AA14880813 (+1)12123141191AA112 (+1)88
Home→ACCB10B12NDP12SECAACCUSAINDMACMWSBC1AA
343421622412927112625180

Games to Watch
My "rank-based interest factor" assigns a value to each game based upon how closely the teams are ranked and the best rank of either team. The range is zero (whenever one of the teams is unranked - i.e. a 1AA team) to 4.5 (both teams ranked #1.)
For the interested, the formula for a 128-team field is
RBIF(R1,R2) = 4.5 × Log ( ( 129 − R1 ) × ( 129 − R2 ) + 1 ) ÷ Log(1282+1)

| R1 − R2 | + Maximum { R1, R2 }
the divisor is the scaling factor to make RBIF(1,1) = 4.5
For the rankings, I use the Majority Consensus rank of the computer rankings published by Dr. Massey. As of this writing there are only four such computers with pre-season ranknigs, so this is based upon the third-best rank of the four.
Updated 2 Sep to include 58 ratings and 30th-best rank.

It turns out that there are only 52 interconference games with RBIFs that correspond to the top half of the field (top 64 vs top 64.)

By RBIF
DateGame
17 Sep#4 Ohio State (B10) at #4 Oklahoma (B12)
5 Sep#8 Mississippi (SEC) vs #10 Florida State (ACC)
17 Sep#12 Michigan State (B10) at #14 Notre Dame (ND)
15 Oct#6 Stanford (P12) at #14 Notre Dame (ND)
3 Sep#21 North Carolina (ACC) vs #21 Georgia (SEC)
10 Sep#20 Arkansas (SEC) at #14 TCU (B12)
26 Nov#14 Notre Dame (ND) at #20 Southern California (P12)
3 Sep#4 Oklahoma (B12) at #19 Houston (AAC)
3 Sep#20 Southern California (P12) vs #1 Alabama (SEC)
3 Sep#27 UCLA (P12) at #30 Texas A&M (SEC)
3 Sep#9 LSU (SEC) vs #25 Wisconsin (B10)
26 Nov#26 Florida (SEC) at #10 Florida State (ACC)
17 Nov#33 Louisville (ACC) at #19 Houston (AAC)
3 Sep#3 Clemson (ACC) at #30 Auburn (SEC)
10 Sep#37 Washington State (P12) at #34 Boise State (MW)
30 Sep#39 Toledo (MAC) at #40 BYU (Ind)
5 Nov#14 Notre Dame (ND) vs #35 Navy (AAC)
20 Oct#40 BYU (Ind) at #34 Boise State (MW)
24 Sep#40 BYU (Ind) vs #33 West Virginia (B12)
17 Sep#22 Oregon (P12) at #39 Nebraska (B10)
17 Sep#27 UCLA (P12) at #40 BYU (Ind)
10 Sep#40 BYU (Ind) at #25 Utah (P12)
14 Oct#23 Mississippi State (SEC) at #40 BYU (Ind)
10 Sep#43 California (P12) at #44 San Diego State (MW)
10 Sep#37 Western Kentucky (CUSA) at #1 Alabama (SEC)
17 Sep#41 Pittsburgh (ACC) at #23 Oklahoma State (B12)
8 Oct#40 BYU (Ind) at #12 Michigan State (B10)
19 Nov#44 Virginia Tech (ACC) at #14 Notre Dame (ND)
17 Sep#48 Texas (B12) at #43 California (P12)
10 Sep#44 Virginia Tech (ACC) vs #11 Tennessee (SEC)
10 Sep#48 Penn State (B10) at #41 Pittsburgh (ACC)
29 Oct#45 Miami-Florida (ACC) at #14 Notre Dame (ND)
1 Oct#46 Memphis (AAC) at #8 Mississippi (SEC)
17 Sep#51 Temple (AAC) at #48 Penn State (B10)
10 Sep#51 Texas Tech (B12) at #47 Arizona State (P12)
24 Sep#51 Bowling Green (MAC) at #46 Memphis (AAC)
4 Sep#14 Notre Dame (ND) at #48 Texas (B12)
24 Sep#10 Florida State (ACC) at #50 South Florida (AAC)
3 Sep#51 Bowling Green (MAC) at #4 Ohio State (B10)
24 Sep#54 Georgia Southern (SBC) at #55 Western Michigan (MAC)
17 Sep#45 Miami-Florida (ACC) at #55 Appalachian State (SBC)
8 Oct#14 Notre Dame (ND) at #53 North Carolina State (ACC)
3 Sep#55 Western Michigan (MAC) at #43 Northwestern (B10)
3 Sep#40 BYU (Ind) vs #55 Arizona (P12)
5 Nov#54 Georgia Southern (SBC) at #8 Mississippi (SEC)
15 Oct#54 Georgia Southern (SBC) at #57 Georgia Tech (ACC)
1 Sep#55 Appalachian State (SBC) at #11 Tennessee (SEC)
17 Sep#57 Duke (ACC) at #43 Northwestern (B10)
2 Sep#56 Kansas State (B12) at #6 Stanford (P12)
26 Nov#57 Georgia Tech (ACC) at #21 Georgia (SEC)
24 Sep#57 Duke (ACC) at #14 Notre Dame (ND)
3 Sep#61 Missouri (SEC) at #33 West Virginia (B12)
By Date
DateGame
1-Sep#55 Appalachian State (SBC) at #11 Tennessee (SEC)
2-Sep#56 Kansas State (B12) at #6 Stanford (P12)
3-Sep#21 North Carolina (ACC) vs #21 Georgia (SEC)
#4 Oklahoma (B12) at #19 Houston (AAC)
#20 Southern California (P12) vs #1 Alabama (SEC)
#27 UCLA (P12) at #30 Texas A&M (SEC)
#9 LSU (SEC) vs #25 Wisconsin (B10)
#3 Clemson (ACC) at #30 Auburn (SEC)
#51 Bowling Green (MAC) at #4 Ohio State (B10)
#55 Western Michigan (MAC) at #43 Northwestern (B10)
#40 BYU (Ind) vs #55 Arizona (P12)
#61 Missouri (SEC) at #33 West Virginia (B12)
4-Sep#14 Notre Dame (ND) at #48 Texas (B12)
5-Sep#8 Mississippi (SEC) vs #10 Florida State (ACC)
10-Sep#20 Arkansas (SEC) at #14 TCU (B12)
#37 Washington State (P12) at #34 Boise State (MW)
#40 BYU (Ind) at #25 Utah (P12)
#43 California (P12) at #44 San Diego State (MW)
#37 Western Kentucky (CUSA) at #1 Alabama (SEC)
#44 Virginia Tech (ACC) vs #11 Tennessee (SEC)
#48 Penn State (B10) at #41 Pittsburgh (ACC)
#51 Texas Tech (B12) at #47 Arizona State (P12)
17-Sep#4 Ohio State (B10) at #4 Oklahoma (B12)
#12 Michigan State (B10) at #14 Notre Dame (ND)
#22 Oregon (P12) at #39 Nebraska (B10)
#27 UCLA (P12) at #40 BYU (Ind)
#41 Pittsburgh (ACC) at #23 Oklahoma State (B12)
#48 Texas (B12) at #43 California (P12)
#51 Temple (AAC) at #48 Penn State (B10)
#45 Miami-Florida (ACC) at #55 Appalachian State (SBC)
#57 Duke (ACC) at #43 Northwestern (B10)
24-Sep#40 BYU (Ind) vs #33 West Virginia (B12)
#51 Bowling Green (MAC) at #46 Memphis (AAC)
#10 Florida State (ACC) at #50 South Florida (AAC)
#54 Georgia Southern (SBC) at #55 Western Michigan (MAC)
#57 Duke (ACC) at #14 Notre Dame (ND)
30-Sep#39 Toledo (MAC) at #40 BYU (Ind)
1-Oct#46 Memphis (AAC) at #8 Mississippi (SEC)
8-Oct#40 BYU (Ind) at #12 Michigan State (B10)
#14 Notre Dame (ND) at #53 North Carolina State (ACC)
14-Oct#23 Mississippi State (SEC) at #40 BYU (Ind)
15-Oct#6 Stanford (P12) at #14 Notre Dame (ND)
#54 Georgia Southern (SBC) at #57 Georgia Tech (ACC)
20-Oct#40 BYU (Ind) at #34 Boise State (MW)
29-Oct#45 Miami-Florida (ACC) at #14 Notre Dame (ND)
5-Nov#14 Notre Dame (ND) vs #35 Navy (AAC)
#54 Georgia Southern (SBC) at #8 Mississippi (SEC)
17-Nov#33 Louisville (ACC) at #19 Houston (AAC)
19-Nov#44 Virginia Tech (ACC) at #14 Notre Dame (ND)
26-Nov#14 Notre Dame (ND) at #20 Southern California (P12)
#26 Florida (SEC) at #10 Florida State (ACC)
#57 Georgia Tech (ACC) at #21 Georgia (SEC)

We can only hope that enough pre-season rankings are way off that we wind up with more than 10 (!??) top-25 vs top-25 interconference matchups over the course of the 2016 season.

© Copyright 2016, Paul Kislanko