This year only 19 of 125 FBS teams play a 12-game FBS schedule. That's in the same range as the number of FCS games back in the day when a non-opponent could only be counted once every four years.
Surprisingly (OK, not) instead of the obvious "schedule better interconference games" approach, the Big Boys are looking to "solve" the problem by scheduling more conference games. I suppose that's an inevitable step on the road to becoming "NFL Lite" with little interregional play of consequence until the playoffs, but I don't believe it will lead to a better product.
By the end of the regular season all 7,750 team-pairs will be connected by no worse than an A plays B plays C plays D Plays Z chain. The 696 games are the paths of length 1. These translate into 15,528 A-plays-B-plays-C paths of length 2 (for 1392 of those A and C are the same!), 173,256 A-plays-B-plays-C-plays-D chains of length 3 (5460 to the same team) and 1,933,614 4-step paths (66,600 with the same beginning and ending team.)
Taking out the paths that begin and end at the same team and accounting for the fact that A→B and B→A are really the same, the 7,750 team-pairs are connected by 1,025,169 paths of lengths 1, 2, 3 or 4.
These paths are what make computer comparisons of teams that haven't played and have no common opponents possible - the majority of that million data are the length 4 paths. This is why adding games within a set of teams that already has a large number of length 1 and 2 connections is not good: most of the length 3 and 4 paths contribute little additional data.
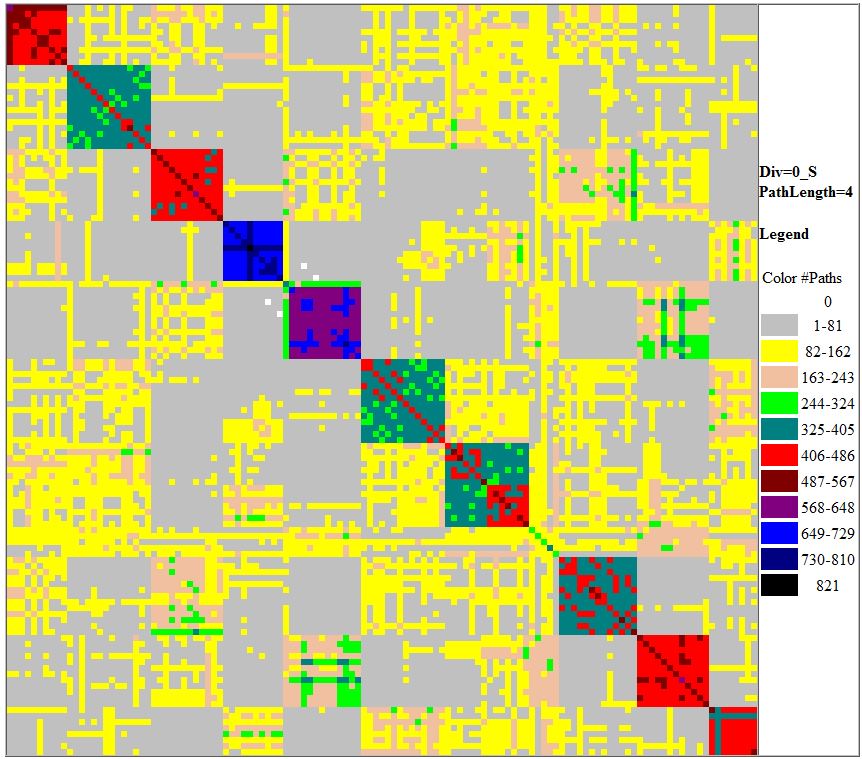
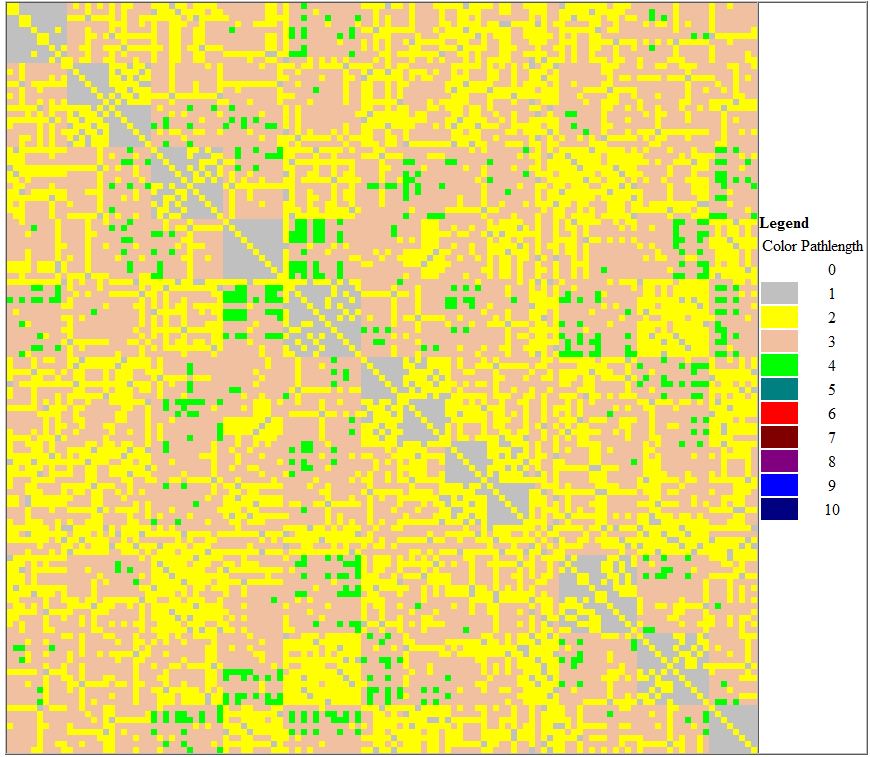
These graphs show how most of the weakly-connected team-pairs involve teams from the two conferences that play a 9-game conference schedule, and the most weakly connected team-pairs involve one team from each of them. The one on the left shows a color code representing the number of paths of length 4 that connect the row-team to the column team. The one on the right is coded to show the length of the shortest path between the row team and column team regardless of how many paths that long there are.
|
|
|
The bands of silver in the chart on the left (and concentrations of fuschia and green in the one on the right) mostly correspond to the Big 12 and Pac 10 teams. Connectivity is also weak between the Big 10 and SEC/Conference USA, and there's an absence of games between MAC teams and Mountain West teams.
Should the ACC and (especially) SEC choose this route, we'd be most of the way to a four 16-team conference structure with eight division winners providing the first interconference play in round one of the playoffs.
|
Leaving out the AAC, the "Big 5" collectively play 33 games between themselves and 57 against non-FBS opponents. All of the latter at home, of course.