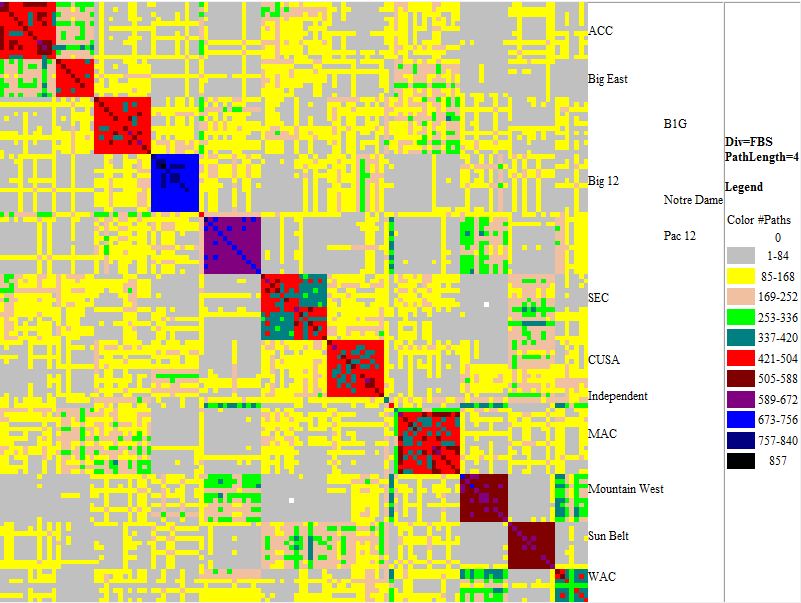
While the connectivity metrics indicate that FBS still does not need more than a 2-team playoff, if the trend towards larger conferences and fewer interconference FBS-FBS games by the time we have a four-team playoff it will. Though still not as much as the other divisions do.
| FBS | FCS | D2 | D3 | ||
| #Pairs | 7626 | 7381 | 11325 | 26335 | |
| OO+O%Pairs | 50.38 | 29.67 | 21.49 | 15.81 | % of total pairs that are connected by at least one common opponent |
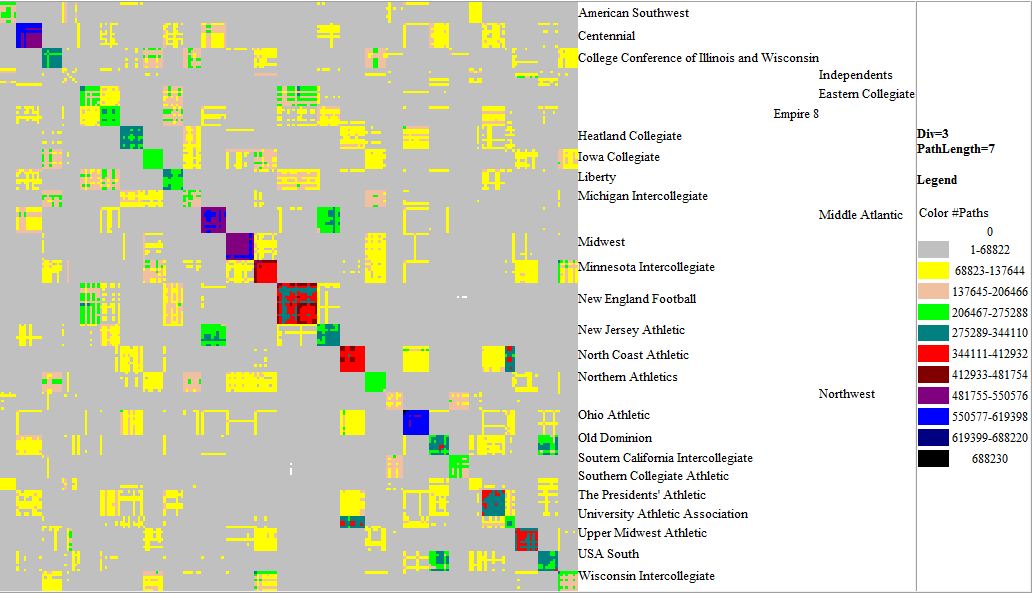
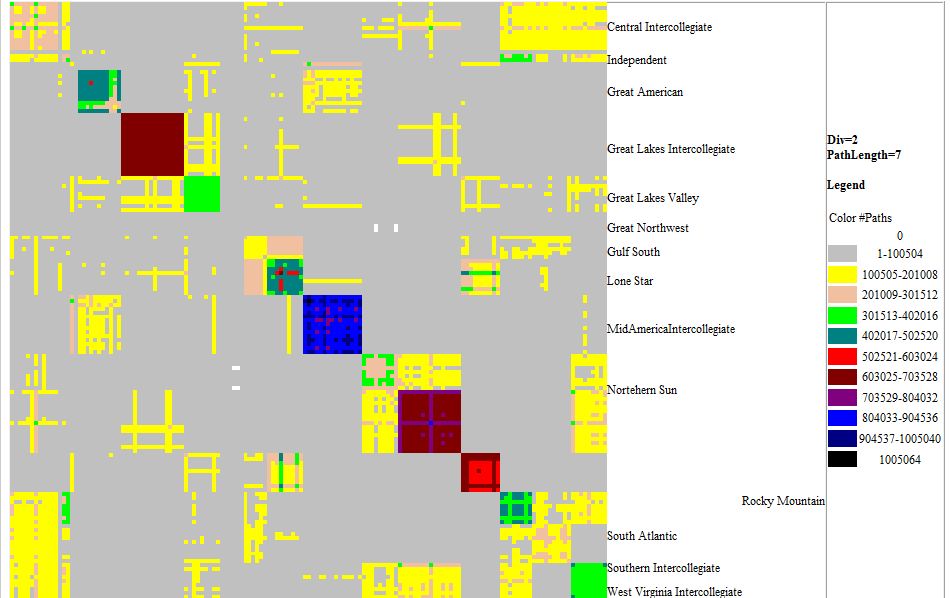
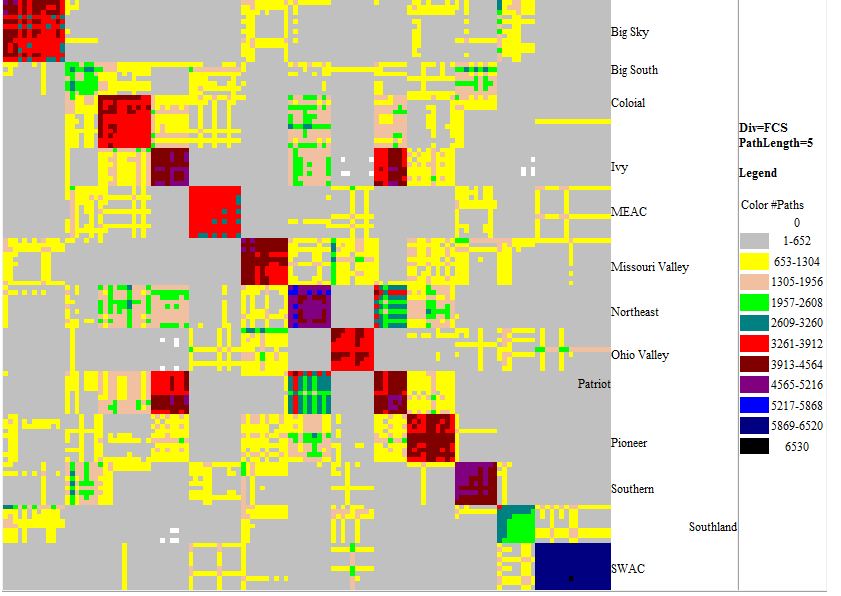
| Connected at PL | 4 | 5 | 7 | 7 | |
| APL | 2.41 | 2.95 | 3.39 | 3.69 | |
| #Teams | 124 | 122 | 151 | 230 | |
| OO+O#Teams | 64 | 3 | 1 | 0 | # of teams with half the field or better as Os or O-Os |
| OO+O%Teams | 51.6 | 2.5 | 0.7 | 0.0 | % of teams that are connected to half the field or better as Os or O-Os |
| %Pairs at | |||||
| PL=1 | 9.55 | 8.17 | 6.64 | 4.31 | |
| PL=2 | 40.83 | 21.5 | 14.85 | 11.5 | |
| PL=3 | 48.37 | 41.44 | 31.05 | 28.13 | |
| PL=4 | 1.25 | 24.86 | 30.17 | 30.31 | |
| PL=5 | 4.02 | 15.1 | 18.99 | ||
| PL=6 | 0.16 | 5.95 | |||
| PL-7 | 0.81 | ||||
| Paths/pair | 303.3 | 1607 | 14972.1 | 86156.5 |