As I pointed out in The More Things Change... back in July, with this weekend's games the FBS games graph is connected with diameter four, the same as it will have at the end of the regular season. Before today, two team-pairs (Hawai'i↔Tennesse and Tennessee↔Washington State) required at least five steps in an "A played B played .. played Z" chain to be connected.
When the maximum pathlength for any team-pair is applied to all team-pairs for games before today's games, an advanced rating system will process at least 2,661,615 paths for 7,626 team-pairs. 95,960 begin and end at the same team.
After November 10th's games, the diameter of the games graph is four, and the number of paths used is "only" 425,270 plus 32,830 that begin and end at the same team.
|
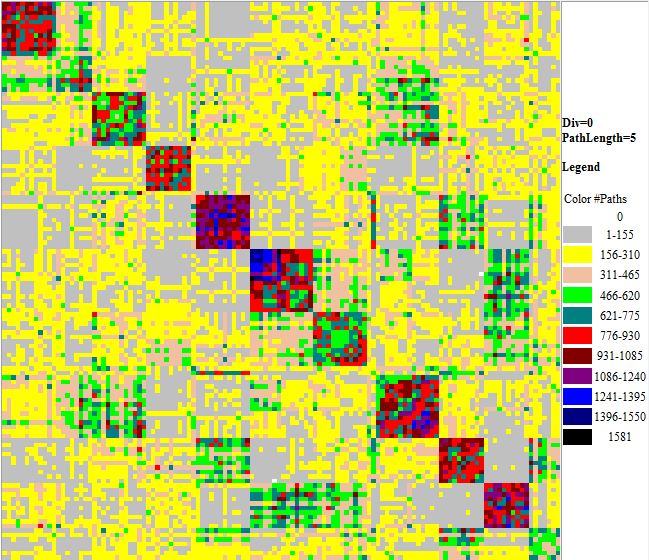
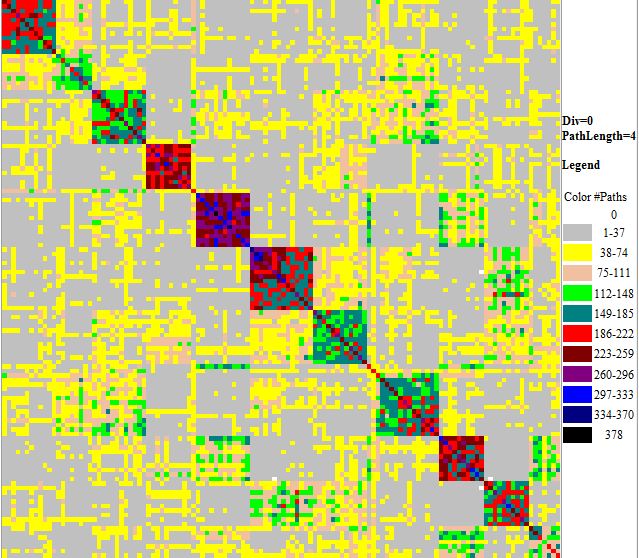
This actually understates the effect of paths that begin and end at the same team. More about that in a bit. First, here's a graphical depiction of the number of paths between each team-pair. Teams are listed in rows and columns in the same order as in the standings.

After November 10th's games, the diameter of the games graph is four.

The reason that the number of paths of length n that begin and end at the same team is of interest is that if it takes N steps to connect the field, the teams' opponents (at length one) get counted not just at the path of length 1, but once each at pathlength 3 for each of the length 2 paths that begin and end at the team. This means that as the games graph becomes less connected, teams' opponents (and to a lesser extent opponents' opponents) are given more weight.
Notice how the contraction of the games graph from diameter 5 to 4 changes the effect:
|
The "problem" if there is one is the wide variation among teams. What the advanced ratings are calculating may be different depending upon how the team's schedule is embedded in the games graph.