Another Measurement of Schedule Difficulty
Last time I described a measurement based upon teams' ranks that could be used to order games by how "interesting" they are from the rankings' perspective. If we were to draw the interest curves for each rank and each possible opponents' rank the peaks would always come at the team's own rank.
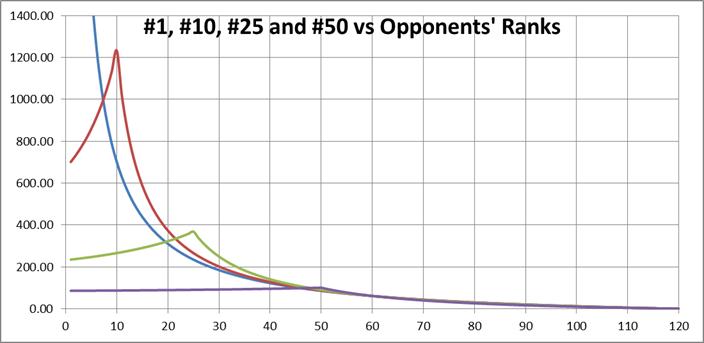
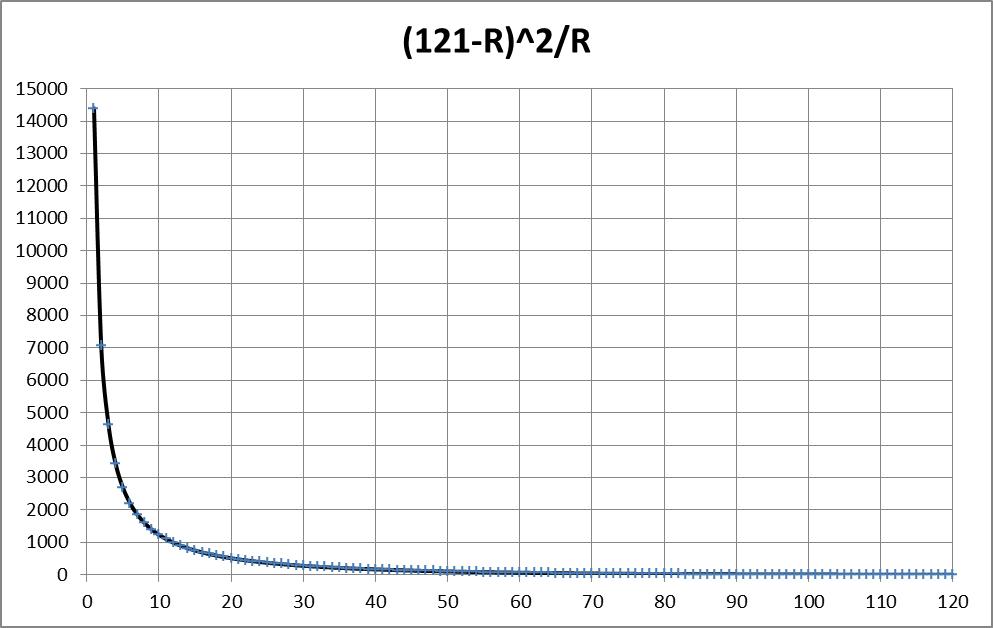
For each team's rank, the maximum "interest value" occurs when their opponent has the same rank as them, so the set of all maxima is given by
N+1 is just 121, so that is just (121 - R)2 ÷ R:
It strikes me that if the "interest factor" of all a team's games gives something of a relative SOS then we could define an absolute SOS just by averaging this function for all opponents' ranks.
Aside: When we have rating values to work with, there are much better approaches. Here we have only ranks as input and averaging ranks is not very illuminating.
Now, while I kinda like this, there's a bit of a problem. Giving a value of zero to games against unranked teams distorts the averages for non-conference SOS. One way to address that would be to include bye weeks in the average (and that thought is not indefensible, but there's no way - or too many ways - to assign bye weeks to "noncference" or "conference" schedule strength.)
So, instead of averaging them in, we'll just pretend that games against unranked teams are the same as bye weeks. As the season is played out, I'll average in the games that ranked teams lose to unranked teams.
Based upon 48 computer ratings as of today (3 Sep) - meaning I use the 25th-best ranking - here're the lists:
Non-Conference
| ix | Total | Avg | Rank | Team | Conf |
| 1 | 5077.4 | 2538.70 | 73 | Toledo | MAC |
| 2 | 8077.5 | 2019.38 | 38 | Tulsa | CUSA |
| 3 | 4950.9 | 1650.32 | 9 | LSU | SEC |
| 4 | 8194.5 | 1638.90 | 26 | Nevada | WAC |
| 5 | 4710.5 | 1570.16 | 100 | Kent State | MAC |
| 6 | 4665.2 | 1555.06 | 41 | Penn State | B10 |
| 7 | 3818.3 | 1272.75 | 13 | Florida State | ACC |
| 8 | 4874.2 | 1218.55 | 111 | North Texas | SBC |
| 9 | 3481.4 | 1160.47 | 33 | Georgia | SEC |
| 10 | 3348.9 | 1116.31 | 101 | UL Monroe | SBC |
| 11 | 2927.6 | 975.88 | 70 | SMU | CUSA |
| 12 | 2709.3 | 903.11 | 82 | Duke | ACC |
| 13 | 3549.7 | 887.42 | 109 | Ball State | MAC |
| 14 | 1740.9 | 870.45 | 3 | Oregon | P12 |
| 15 | 4325.1 | 865.02 | 72 | Fresno State | WAC |
| 16 | 771.0 | 770.99 | 30 | Arizona State | P12 |
| 17 | 1481.0 | 740.51 | 112 | Western Kentucky | SBC |
| 18 | 1232.8 | 616.41 | 35 | Arizona | P12 |
| 19 | 3004.8 | 600.95 | 108 | San Jose State | WAC |
| 20 | 1765.4 | 588.46 | 33 | Miami-Florida | ACC |
| 21 | 1686.5 | 562.17 | 68 | Colorado | P12 |
| 22 | 1668.6 | 556.19 | 119 | Akron | MAC |
| 23 | 1069.6 | 534.82 | 41 | Oregon State | P12 |
| 24 | 1560.0 | 520.00 | 40 | Clemson | ACC |
| 25 | 1447.8 | 482.61 | 112 | UL Lafayette | SBC |
| ix | Total | Avg | Rank | Team | Conf |
| 26 | 1716.5 | 429.13 | 111 | Florida Atlantic | SBC |
| 27 | 1688.2 | 422.04 | 79 | East Carolina | CUSA |
| 28 | 419.9 | 419.94 | 28 | Utah | P12 |
| 29 | 1567.6 | 391.89 | 28 | West Virginia | BigE |
| 30 | 1465.7 | 366.42 | 114 | New Mexico | MW |
| 31 | 723.5 | 361.74 | 44 | Washington | P12 |
| 32 | 1079.8 | 359.95 | 4 | Oklahoma | B12 |
| 33 | 1037.9 | 345.97 | 17 | Texas A&M | B12 |
| 34 | 1032.1 | 344.04 | 100 | Arkansas State | SBC |
| 35 | 656.7 | 328.34 | 95 | Central Michigan | MAC |
| 36 | 1271.0 | 317.76 | 93 | Marshall | CUSA |
| 37 | 1248.5 | 312.12 | 79 | Troy | SBC |
| 38 | 920.6 | 306.87 | 50 | Northern Illinois | MAC |
| 39 | 905.2 | 301.75 | 24 | Florida | SEC |
| 40 | 1171.6 | 292.89 | 98 | Utah State | WAC |
| 41 | 842.6 | 280.88 | 40 | Maryland | ACC |
| 42 | 835.3 | 278.43 | 90 | Idaho | WAC |
| 43 | 1066.7 | 266.67 | 32 | Pittsburgh | BigE |
| 44 | 519.2 | 259.60 | 85 | Wake Forest | ACC |
| 45 | 518.1 | 259.03 | 27 | Michigan State | B10 |
| 46 | 674.5 | 224.82 | 50 | Boston College | ACC |
| 47 | 659.0 | 219.66 | 12 | Arkansas | SEC |
| 48 | 860.8 | 215.19 | 95 | UAB | CUSA |
| 49 | 643.0 | 214.32 | 97 | Wyoming | MW |
| 50 | 611.5 | 203.85 | 36 | Air Force | MW |
| ix | Total | Avg | Rank | Team | Conf |
| 51 | 587.6 | 195.87 | 23 | Southern California | P12 |
| 52 | 751.4 | 187.86 | 50 | South Florida | BigE |
| 53 | 725.2 | 181.29 | 75 | Miami-Ohio | MAC |
| 54 | 530.2 | 176.72 | 5 | Stanford | P12 |
| 55 | 347.5 | 173.77 | 45 | Texas Tech | B12 |
| 56 | 520.5 | 173.51 | 80 | Purdue | B10 |
| 57 | 339.1 | 169.54 | 71 | Iowa State | B12 |
| 58 | 334.4 | 167.18 | 78 | Temple | MAC |
| 59 | 828.0 | 165.60 | 4 | Boise State | MW |
| 60 | 654.8 | 163.70 | 48 | Michigan | B10 |
| 61 | 314.8 | 157.42 | 109 | Bowling Green | MAC |
| 62 | 304.2 | 152.12 | 17 | Missouri | B12 |
| 63 | 451.0 | 150.32 | 61 | Syracuse | BigE |
| 64 | 449.6 | 149.87 | 106 | UNLV | MW |
| 65 | 596.6 | 149.16 | 82 | Louisiana Tech | WAC |
| 66 | 445.9 | 148.64 | 82 | Minnesota | B10 |
| 67 | 444.9 | 148.29 | 116 | Buffalo | MAC |
| 68 | 267.1 | 133.56 | 117 | Eastern Michigan | MAC |
| 69 | 393.3 | 131.11 | 10 | Oklahoma State | B12 |
| 70 | 256.9 | 128.46 | 13 | Wisconsin | B10 |
| 71 | 247.8 | 123.88 | 61 | Georgia Tech | ACC |
| 72 | 239.1 | 119.54 | 58 | Kansas State | B12 |
| 73 | 337.3 | 112.44 | 79 | Western Michigan | MAC |
| 74 | 410.1 | 102.52 | 62 | Cincinnati | BigE |
| 75 | 302.8 | 100.92 | 44 | Illinois | B10 |
| ix | Total | Avg | Rank | Team | Conf |
| 76 | 289.5 | 96.51 | 48 | UCF | CUSA |
| 77 | 286.7 | 95.57 | 32 | Iowa | B10 |
| 78 | 273.6 | 91.20 | 19 | South Carolina | SEC |
| 79 | 269.1 | 89.70 | 84 | Rutgers | BigE |
| 80 | 159.8 | 79.92 | 92 | Kansas | B12 |
| 81 | 234.2 | 78.07 | 63 | Louisville | BigE |
| 82 | 307.6 | 76.89 | 8 | Ohio State | B10 |
| 83 | 229.7 | 76.56 | 45 | Texas | B12 |
| 84 | 224.3 | 74.77 | 67 | Mississippi | SEC |
| 85 | 443.0 | 73.83 | 117 | New Mexico State | WAC |
| 86 | 213.5 | 71.18 | 6 | TCU | MW |
| 87 | 282.0 | 70.49 | 96 | Rice | CUSA |
| 88 | 352.4 | 70.48 | 53 | Hawaii | WAC |
| 89 | 124.4 | 62.20 | 85 | Washington State | P12 |
| 90 | 174.0 | 58.01 | 17 | Nebraska | B10 |
| 91 | 170.3 | 56.77 | 12 | Auburn | SEC |
| 92 | 169.1 | 56.37 | 64 | UCLA | P12 |
| 93 | 161.4 | 53.80 | 3 | Alabama | SEC |
| 94 | 186.0 | 46.49 | 101 | Middle Tenn State | SBC |
| 95 | 183.0 | 45.75 | 84 | Florida Intl | SBC |
| 96 | 179.1 | 44.76 | 107 | Tulane | CUSA |
| 97 | 132.4 | 44.15 | 58 | Southern Miss | CUSA |
| 98 | 173.9 | 43.46 | 46 | San Diego State | MW |
| 99 | 121.6 | 40.52 | 63 | Northwestern | B10 |
| 100 | 121.0 | 40.35 | 92 | Vanderbilt | SEC |
| ix | Total | Avg | Rank | Team | Conf |
| 101 | 104.1 | 34.70 | 98 | UTEP | CUSA |
| 102 | 33.3 | 33.35 | 50 | California | P12 |
| 103 | 63.3 | 31.63 | 30 | North Carolina State | ACC |
| 104 | 92.0 | 30.67 | 41 | North Carolina | ACC |
| 105 | 91.5 | 30.49 | 76 | Virginia | ACC |
| 106 | 60.5 | 30.26 | 63 | Kentucky | SEC |
| 107 | 70.2 | 23.41 | 69 | Houston | CUSA |
| 108 | 60.3 | 20.11 | 49 | Tennessee | SEC |
| 109 | 66.9 | 16.72 | 52 | Connecticut | BigE |
| 110 | 53.7 | 13.42 | 103 | Colorado State | MW |
| 111 | 25.7 | 12.83 | 22 | Mississippi State | SEC |
| 112 | 35.2 | 11.72 | 13 | Virginia Tech | ACC |
| 113 | 28.9 | 9.62 | 88 | Indiana | B10 |
| 114 | 24.9 | 8.29 | 89 | Ohio | MAC |
| 115 | 6.5 | 6.51 | 55 | Baylor | B12 |
| 116 | 8.4 | 4.19 | 117 | Memphis | CUSA |
|
|
Overall
| ix | Total | Avg | Rank | Team | Conf |
| 1 | 12692.5 | 1153.86 | 9 | LSU | SEC |
| 2 | 9027.2 | 902.72 | 23 | Mississippi State | SEC |
| 3 | 9911.1 | 901.01 | 35 | Arizona | P12 |
| 4 | 9507.2 | 864.29 | 41 | Oregon State | P12 |
| 5 | 9303.1 | 845.73 | 44 | Washington | P12 |
| 6 | 9062.2 | 823.84 | 68 | Mississippi | SEC |
| 7 | 8988.3 | 817.12 | 24 | Florida | SEC |
| 8 | 8914.8 | 810.44 | 12 | Arkansas | SEC |
| 9 | 10497.0 | 807.46 | 67 | Colorado | P12 |
| 10 | 8828.7 | 802.61 | 11 | Auburn | SEC |
| 11 | 8727.0 | 793.37 | 50 | California | P12 |
| 12 | 8535.0 | 775.91 | 85 | Washington State | P12 |
| 13 | 8505.4 | 773.22 | 56 | Baylor | B12 |
| 14 | 8312.4 | 755.67 | 49 | Tennessee | SEC |
| 15 | 9016.3 | 751.36 | 25 | Southern California | P12 |
| 16 | 8263.8 | 751.26 | 41 | Penn State | B10 |
| 17 | 8357.4 | 696.45 | 26 | Nevada | WAC |
| 18 | 8290.8 | 690.90 | 38 | Tulsa | CUSA |
| 19 | 7436.9 | 676.08 | 114 | New Mexico | MW |
| 20 | 6703.3 | 670.33 | 32 | Arizona State | P12 |
| 21 | 6608.7 | 660.87 | 97 | Wyoming | MW |
| 22 | 7126.3 | 647.84 | 95 | Vanderbilt | SEC |
| 23 | 6423.4 | 642.34 | 106 | UNLV | MW |
| 24 | 6342.3 | 634.23 | 35 | Air Force | MW |
| 25 | 6675.6 | 606.88 | 71 | Iowa State | B12 |
| ix | Total | Avg | Rank | Team | Conf |
| 26 | 6591.0 | 599.18 | 45 | Texas Tech | B12 |
| 27 | 6530.4 | 593.67 | 58 | Kansas State | B12 |
| 28 | 6522.5 | 592.95 | 92 | Kansas | B12 |
| 29 | 6773.2 | 564.43 | 17 | Texas A&M | B12 |
| 30 | 6146.2 | 558.75 | 33 | Georgia | SEC |
| 31 | 6024.9 | 547.72 | 103 | Colorado State | MW |
| 32 | 6023.2 | 547.57 | 46 | San Diego State | MW |
| 33 | 6011.3 | 546.48 | 17 | Missouri | B12 |
| 34 | 6469.0 | 539.08 | 45 | Texas | B12 |
| 35 | 5262.4 | 526.24 | 72 | Toledo | MAC |
| 36 | 5710.0 | 519.09 | 3 | Oregon | P12 |
| 37 | 6216.3 | 518.02 | 5 | Stanford | P12 |
| 38 | 5078.4 | 461.67 | 82 | Duke | ACC |
| 39 | 5532.8 | 461.07 | 10 | Oklahoma State | B12 |
| 40 | 4912.9 | 446.62 | 111 | North Texas | SBC |
| 41 | 4883.2 | 443.93 | 100 | Kent State | MAC |
| 42 | 4799.4 | 436.31 | 13 | Florida State | ACC |
| 43 | 4609.1 | 419.01 | 3 | Alabama | SEC |
| 44 | 4799.6 | 399.97 | 72 | Fresno State | WAC |
| 45 | 4231.2 | 384.66 | 40 | Clemson | ACC |
| 46 | 4078.7 | 370.80 | 34 | Miami-Florida | ACC |
| 47 | 4444.7 | 370.39 | 21 | Notre Dame | ND |
| 48 | 4055.0 | 368.63 | 6 | TCU | MW |
| 49 | 4053.4 | 368.49 | 27 | Michigan State | B10 |
| 50 | 4350.6 | 362.55 | 65 | UCLA | P12 |
| ix | Total | Avg | Rank | Team | Conf |
| 51 | 4029.4 | 335.78 | 4 | Oklahoma | B12 |
| 52 | 3655.4 | 332.31 | 80 | Purdue | B10 |
| 53 | 3578.6 | 325.33 | 19 | South Carolina | SEC |
| 54 | 3577.9 | 325.27 | 17 | Nebraska | B10 |
| 55 | 3200.4 | 320.04 | 63 | Kentucky | SEC |
| 56 | 3156.0 | 315.60 | 13 | Wisconsin | B10 |
| 57 | 3152.6 | 315.26 | 86 | Wake Forest | ACC |
| 58 | 3460.8 | 314.62 | 88 | Indiana | B10 |
| 59 | 3748.9 | 312.41 | 109 | Ball State | MAC |
| 60 | 3401.5 | 309.23 | 100 | UL Monroe | SBC |
| 61 | 3652.5 | 304.37 | 48 | Michigan | B10 |
| 62 | 3345.0 | 304.09 | 71 | SMU | CUSA |
| 63 | 3294.6 | 299.51 | 51 | Boston College | ACC |
| 64 | 3515.0 | 292.92 | 108 | San Jose State | WAC |
| 65 | 3136.8 | 285.16 | 44 | Illinois | B10 |
| 66 | 3099.1 | 281.74 | 39 | BYU | Ind |
| 67 | 3379.2 | 281.60 | 4 | Boise State | MW |
| 68 | 2825.4 | 256.86 | 85 | Minnesota | B10 |
| 69 | 2784.0 | 253.09 | 77 | Virginia | ACC |
| 70 | 2563.2 | 233.02 | 40 | Maryland | ACC |
| 71 | 2171.5 | 217.15 | 61 | Georgia Tech | ACC |
| 72 | 2595.5 | 216.29 | 8 | Ohio State | B10 |
| 73 | 2183.4 | 198.49 | 28 | West Virginia | BigE |
| 74 | 1746.1 | 174.61 | 26 | Utah | P12 |
| 75 | 1631.2 | 163.12 | 30 | North Carolina State | ACC |
| ix | Total | Avg | Rank | Team | Conf |
| 76 | 1786.1 | 162.38 | 98 | Utah State | WAC |
| 77 | 1934.2 | 161.19 | 79 | East Carolina | CUSA |
| 78 | 1767.8 | 160.71 | 41 | North Carolina | ACC |
| 79 | 1759.4 | 159.95 | 119 | Akron | MAC |
| 80 | 1755.7 | 159.61 | 63 | Northwestern | B10 |
| 81 | 1748.2 | 158.93 | 32 | Pittsburgh | BigE |
| 82 | 1881.9 | 156.82 | 111 | Florida Atlantic | SBC |
| 83 | 1541.6 | 154.16 | 112 | Western Kentucky | SBC |
| 84 | 1619.8 | 147.25 | 32 | Iowa | B10 |
| 85 | 1704.8 | 142.07 | 93 | Marshall | CUSA |
| 86 | 1530.0 | 139.09 | 50 | South Florida | BigE |
| 87 | 1504.2 | 136.75 | 113 | UL Lafayette | SBC |
| 88 | 1331.5 | 133.15 | 88 | Idaho | WAC |
| 89 | 1416.5 | 128.78 | 52 | Navy | Ind |
| 90 | 1269.8 | 126.98 | 61 | Syracuse | BigE |
| 91 | 1182.9 | 118.29 | 85 | Rutgers | BigE |
| 92 | 1286.5 | 116.96 | 65 | Cincinnati | BigE |
| 93 | 1106.6 | 110.66 | 63 | Louisville | BigE |
| 94 | 1285.4 | 107.12 | 78 | Troy | SBC |
| 95 | 1267.2 | 105.60 | 96 | UAB | CUSA |
| 96 | 1084.7 | 98.61 | 100 | Arkansas State | SBC |
| 97 | 1058.0 | 96.18 | 82 | Louisiana Tech | WAC |
| 98 | 990.8 | 90.07 | 50 | Northern Illinois | MAC |
| 99 | 830.6 | 83.06 | 95 | Central Michigan | MAC |
| 100 | 898.0 | 81.64 | 52 | Connecticut | BigE |
| ix | Total | Avg | Rank | Team | Conf |
| 101 | 950.1 | 73.08 | 117 | New Mexico State | WAC |
| 102 | 790.9 | 71.90 | 13 | Virginia Tech | ACC |
| 103 | 810.8 | 67.57 | 75 | Miami-Ohio | MAC |
| 104 | 773.4 | 64.45 | 52 | Hawaii | WAC |
| 105 | 657.1 | 59.74 | 86 | Army | Ind |
| 106 | 614.2 | 55.83 | 48 | UCF | CUSA |
| 107 | 611.9 | 55.63 | 116 | Buffalo | MAC |
| 108 | 539.4 | 53.94 | 109 | Bowling Green | MAC |
| 109 | 568.6 | 51.69 | 97 | UTEP | CUSA |
| 110 | 619.0 | 51.58 | 99 | Rice | CUSA |
| 111 | 509.6 | 46.33 | 79 | Western Michigan | MAC |
| 112 | 436.7 | 43.67 | 117 | Eastern Michigan | MAC |
| 113 | 414.7 | 41.47 | 78 | Temple | MAC |
| 114 | 478.9 | 39.90 | 106 | Tulane | CUSA |
| 115 | 334.4 | 30.40 | 69 | Houston | CUSA |
| 116 | 329.7 | 29.97 | 58 | Southern Miss | CUSA |
| 117 | 267.3 | 26.73 | 117 | Memphis | CUSA |
| 118 | 221.7 | 20.15 | 83 | Florida Intl | SBC |
| 119 | 239.0 | 19.91 | 101 | Middle Tenn State | SBC |
| 120 | 90.1 | 8.20 | 89 | Ohio | MAC |
|
|