Now that another season is in the books we can get back to the interminable my conference is better than your conference arguments, pointless as they may be. There are nearly an infinity of comparitive metrics typically used in such arguments, most of which are subject to (mis)interpretation.
The problem is that conferences don't play the games. Any metric that aggregates team ratings into conference ratings is going to be more or less affected by extremes on either end of the "good-bad" spectrum as measured against any particular criterion. In this column we will apply a rating to all of the Football Bowl Subdivision teams and then use a simple counting stat to find out where the teams in each conference fall.
The ISOV WRRV value is very slightly better than that for the Massey BCS rating. At this writing it is the 10th best of 84 published computer ratings. I'll describe the WRRV in more detail next time, but basically it is a function of the size of an "upset" in MOV and the difference in ranks that involve a violation, and the rank of the losing team.
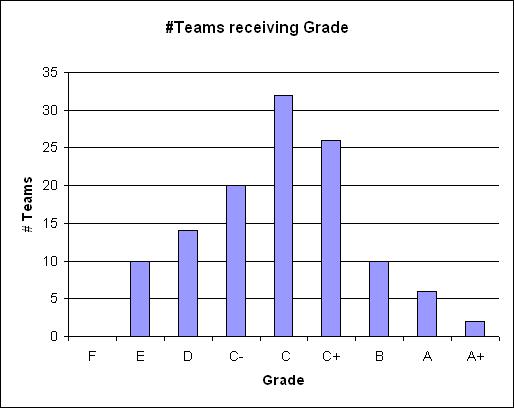
Because of the way it is calculated the ISOV is approximately normally distributed - 65 percent of the values are within one standard deviation from the mean.
|
|
| Grade distribution by ISOV |
Here we've just used "grades" to indicate the distance from the mean (μ) in standard deviations (σ). If a team's rating is greater than or equal to μ − ½ × σ but less than μ + ½ × σ we assign it a "C"; the other grades are assigned higher or lower grades based upon (½)σ increments above or below "C".
We could just reproduce the chart above for each conference to count the number of conference teams that receivd each grade, but since there are different numbers of teams in various conferences it is more informative to tabulate the percentage of teams in each conference that received the specific grades.
|
A fascinating aspect of predictive ratings is that even when they're right they can be wrong. For instance, the ISOV correctly predicted Mississippi State's win over Auburn early in the year, but now rates Auburn significantly better than Mississippi State, so that game is now a "retrodictive violation" for the ISOV, even though the ISOV predicted that game correctly. Likewise ISOV ratings for teams that played games it incorrectly predicted have been adjusted to the point where those games are not retrodictive violations.
I'll address the problem of measuring rankings later.
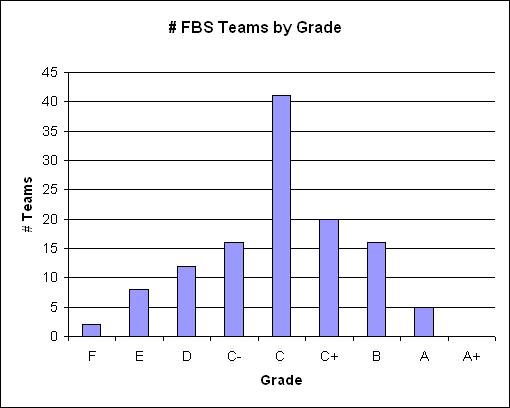
To account for the "fuzziness" inherent to predictive systems we perform the same analysis using a retrodictive system, and the best one (by the WRRV criterion) for which we have rating values is the Massey-BCS. It also distributes rating values in an approximately normal manner, with 64.2 percent of observed values falling within one standard deviation from the mean:
|
| Grade distribution by Massey-BCS |
Again we count the percentage of teams in each conference that receive a given grade:
|
In general I don't think there's a valid way to sum up team performance into conference "performance", but if you must order conferences by which had the best teams this year, this is as good a measure as any. You could give the SEC and Pac 10 an "A", the Big 12, ACC, Big East and Big Ten a "B", the Mountain West and WAC a "C" and every other conference an "incomplete" if you're an easy a grader as I am.
Dirk Chatelain of the Omaha Post Herald wrote College Football: Big 12 scoring was tops in nation pointing out that
about which one smart-aleck SEC fan (is that redundant?) remarked on a message board:
Big 12 teams averaged 33.4 points per game in 2007, a mark believed to be the highest conference average in Division I-A history, according to an NCAA official. Five of the nation's top nine offenses came from the Big 12 � Nebraska ranked ninth. Oklahoma was 19th in the country, but couldn't even crack the Big 12's top half.
So the question is, "which is it, great offenses or mediocre defenses?"
That makes perfect sense. When your opponents don't play defense, you're going to score more.
When the question came up in 2005 (regarding Western offenses vs southeastern - ACC more than SEC in that year) I came up with a way to mormalize scoring stats. Basically you just use the available game data to define a model that can be used to calculate what teams' average scores might be if they'd played every other team in division 1A.
The answer this year turns out to be the same as then - it's some of both. Even if every team had played the same defenses, the Big 12 in aggregate had better offenses than any other conference.
|
The "weighted median" combines how much better or worse the best (worst) teams in the conference are than the middle of the whole field. A larger negative number means the conference is "top-heavy" and a large positive number means it is "bottom-heavy."
There are still six Big 12 teams in the top 20, but there are also six SEC teams, and while the Big 12 overall sorts into 1st, it also has two teams with offenses worse than the worst offenses in the Pac 10 and SEC. A more enlightening view of the same data emphasizes that it is team performance that matters more. In this table we list the teams by rank and conference, with conference champions indicated by a †:
| N_PF | Rec | B12 | P10 | SEC | BigE/ND | B10 | ACC | nBCS |
| 1 | 9-4 | Florida | ||||||
| 2 | 12-2 | LSU† | ||||||
| 3 | 11-2 | West Virginia† | ||||||
| 4 | 12-2 | Missouri | ||||||
| 5 | 9-4 | Oregon | ||||||
| 6 | 11-3 | Oklahoma† | ||||||
| 7 | 12-1 | Kansas | ||||||
| 8 | 9-4 | South Florida | ||||||
| 9 | 11-2 | Southern California† | ||||||
| 10 | 8-5 | Arkansas | ||||||
| 11 | 10-3 | Texas | ||||||
| 12 | 11-2 | Ohio State† | ||||||
| 13 | 8-5 | Kentucky | ||||||
| 14 | 10-3 | Arizona St | ||||||
| 15 | 9-4 | Texas Tech | ||||||
| 16 | 10-3 | Cincinnati | ||||||
| 17 | 11-2 | Georgia | ||||||
| 18 | 7-6 | Oklahoma St | ||||||
| 19 | 10-4 | Tennessee | ||||||
| 20 | 10-3 | Boise St | ||||||
| 21 | 9-4 | Clemson | ||||||
| 22 | 7-6 | Michigan St | ||||||
| 23 | 5-7 | Nebraska | ||||||
| 24 | 9-4 | Penn State | ||||||
| 25 | 4-9 | Washington | ||||||
| 26 | 8-4 | Troy | ||||||
| 27 | 5-7 | Kansas St | ||||||
| 28 | 6-6 | Louisville | ||||||
| 29 | 7-6 | California | ||||||
| 30 | 9-4 | Illinois | ||||||
| 31 | 8-5 | Navy | ||||||
| 32 | 8-5 | Rutgers | ||||||
| 33 | 10-4 | Tulsa | ||||||
| 34 | 11-3 | Virginia Tech† | ||||||
| 35 | 12-1 | Hawaii†WAC | ||||||
| 36 | 9-4 | Michigan | ||||||
| 37 | 11-2 | BYU†MW | ||||||
| 38 | 9-4 | Wisconsin | ||||||
| 39 | 8-5 | Purdue | ||||||
| 40 | 9-4 | Oregon St | ||||||
| 41 | 5-7 | Arizona | ||||||
| 42 | 9-4 | Fresno St | ||||||
| 43 | 10-4 | UCF†CUSA | ||||||
| 44 | 9-4 | Auburn | ||||||
| 45 | 7-6 | Texas A&M | ||||||
| 46 | 11-3 | Boston College | ||||||
| 47 | 10-3 | Connecticut | ||||||
| 48 | 9-4 | Air Force | ||||||
| 49 | 6-6 | South Carolina | ||||||
| 50 | 9-4 | Utah | ||||||
| 51 | 6-7 | Colorado | ||||||
| 52 | 7-6 | Alabama | ||||||
| 53 | 8-5 | TCU | ||||||
| 54 | 8-6 | Central Michigan†MAC | ||||||
| 55 | 8-5 | Wake Forest | ||||||
| 56 | 5-7 | Washington St | ||||||
| 57 | 7-6 | Indiana | ||||||
| 58 | 7-6 | Florida St | ||||||
| 59 | 8-5 | East Carolina | ||||||
| 60 | 7-6 | Ball State | ||||||
| 61 | 8-5 | Florida Atlantic†SBC | ||||||
| 62 | 9-4 | Virginia | ||||||
| 63 | 6-7 | Maryland | ||||||
| 64 | 6-7 | UCLA | ||||||
| 65 | 8-5 | Houston | ||||||
| 66 | 5-7 | Pittsburgh | ||||||
| 67 | 6-7 | Nevada | ||||||
| 68 | 7-6 | Georgia Tech | ||||||
| 69 | 6-6 | Northwestern | ||||||
| 70 | 1-11 | Minnesota | ||||||
| 71 | 5-7 | Toledo | ||||||
| 72 | 5-7 | Vanderbilt | ||||||
| 73 | 8-5 | Mississippi St | ||||||
| 74 | 7-6 | Southern Miss | ||||||
| 75 | 4-8 | UTEP | ||||||
| 76 | 3-9 | Rice | ||||||
| 77 | 9-4 | New Mexico | ||||||
| 78 | 8-5 | Bowling Green | ||||||
| 79 | 3-9 | Colorado St | ||||||
| 80 | 5-7 | Middle Tenn St | ||||||
| 81 | 4-8 | San Diego St | ||||||
| 82 | 4-8 | Stanford | ||||||
| 83 | 5-7 | Miami-Florida | ||||||
| 84 | 4-8 | North Carolina | ||||||
| 85 | 7-6 | Memphis | ||||||
| 86 | 6-6 | Ohio | ||||||
| 87 | 3-9 | Mississippi | ||||||
| 88 | 3-9 | Marshall | ||||||
| 89 | 6-6 | Iowa | ||||||
| 90 | 1-11 | SMU | ||||||
| 91 | 5-7 | Western Michigan | ||||||
| 92 | 6-6 | UL Monroe | ||||||
| 93 | 5-7 | North Carolina St | ||||||
| 94 | 5-7 | Wyoming | ||||||
| 95 | 3-9 | Iowa State | ||||||
| 96 | 5-7 | Buffalo | ||||||
| 97 | 5-7 | Arkansas St | ||||||
| 98 | 3-9 | UL Lafayette | ||||||
| 99 | 2-10 | UNLV | ||||||
| 100 | 2-10 | North Texas | ||||||
| 101 | 3-9 | Notre Dame | ||||||
| 102 | 4-8 | Eastern Michigan | ||||||
| 103 | 1-11 | Duke | ||||||
| 104 | 4-8 | Tulane | ||||||
| 105 | 2-10 | Syracuse | ||||||
| 106 | 6-7 | Miami-Ohio | ||||||
| 107 | 2-10 | Utah St | ||||||
| 108 | 4-9 | New Mexico St | ||||||
| 109 | 5-7 | Louisiana Tech | ||||||
| 110 | 1-11 | Idaho | ||||||
| 111 | 3-9 | Baylor | ||||||
| 112 | 3-9 | Kent St | ||||||
| 113 | 4-8 | Akron | ||||||
| 114 | 5-7 | San Jose St | ||||||
| 115 | 2-10 | UAB | ||||||
| 116 | 3-9 | Army | ||||||
| 117 | 7-5 | Western Kentucky | ||||||
| 118 | 2-10 | Northern Illinois | ||||||
| 119 | 1-11 | Florida Intl | ||||||
| 120 | 4-8 | Temple |
Among the BCS autobid conferences, only the Big East and Big Ten were won by the teams with the best scoring offenses. Even those might have been coincidences, as we see from the scoring defense data.
The SEC is caricatured (not characterized) by the talking cliche-spewing heads as being the toughest conference from a defensive standpoint. That is only true to the extent that the worst defense in the SEC was still better than over half the defenses in the Bowl Subdivision - the best defenses weren't in the SEC - the best offenses were!
In fact, five BCS autobid conferences plus the Mountain West had exactly three teams in the top 20. The ACC only had two, which somewhat belies the notion that the offenses looked so bad because of the good defenses they faced.
|
Again, the list by team is telling. In the two BCS conferences won by the best scoring offense, the champions were also the best scoring defense. It was only in the Big 12 where neither the best offense nor the best defense won, and in that case the champion was second in both categories.
And it must be conceded that the smart-aleck had a point: in scoring defense adjusted for strength of schedule, not only did all other BCS conferences rank higher than the Big 12, so did the Mountain West. (Aside: It is not a coincidence that the MW had the best bowl season of any multi-bowl conference, at 4-1. Their games were mostly defensive mismatches - their teams played D, their opponents mostly didn't.)
| N_PA | Rec | SEC | P10 | BigE/ND | ACC | B10 | B12 | nBCS |
| 1 | 11-2 | Ohio State† | ||||||
| 2 | 11-2 | Southern California† | ||||||
| 3 | 11-2 | West Virginia† | ||||||
| 4 | 12-2 | LSU† | ||||||
| 5 | 9-4 | Auburn | ||||||
| 6 | 11-3 | Virginia Tech† | ||||||
| 7 | 12-1 | Kansas | ||||||
| 8 | 9-4 | Penn State | ||||||
| 9 | 9-4 | Utah | ||||||
| 10 | 11-2 | Georgia | ||||||
| 11 | 9-4 | Clemson | ||||||
| 12 | 10-3 | Cincinnati | ||||||
| 13 | 9-4 | Michigan | ||||||
| 14 | 11-3 | Oklahoma† | ||||||
| 15 | 8-5 | TCU | ||||||
| 16 | 10-3 | Connecticut | ||||||
| 17 | 10-3 | Arizona St | ||||||
| 18 | 9-4 | Oregon | ||||||
| 19 | 11-2 | BYU†MW | ||||||
| 20 | 12-2 | Missouri | ||||||
| 21 | 9-4 | Florida | ||||||
| 22 | 9-4 | Virginia | ||||||
| 23 | 9-4 | South Florida | ||||||
| 24 | 9-4 | Oregon St | ||||||
| 25 | 9-4 | Illinois | ||||||
| 26 | 6-7 | UCLA | ||||||
| 27 | 9-4 | Wisconsin | ||||||
| 28 | 11-3 | Boston College | ||||||
| 29 | 7-6 | Florida St | ||||||
| 30 | 6-7 | Maryland | ||||||
| 31 | 6-6 | Iowa | ||||||
| 32 | 7-6 | Alabama | ||||||
| 33 | 5-7 | Vanderbilt | ||||||
| 34 | 7-6 | Georgia Tech | ||||||
| 35 | 10-3 | Texas | ||||||
| 36 | 6-6 | South Carolina | ||||||
| 37 | 9-4 | New Mexico | ||||||
| 38 | 8-5 | Wake Forest | ||||||
| 39 | 10-4 | Tennessee | ||||||
| 40 | 8-5 | Mississippi St | ||||||
| 41 | 9-4 | Air Force | ||||||
| 42 | 8-5 | Rutgers | ||||||
| 43 | 7-6 | California | ||||||
| 44 | 5-7 | Arizona | ||||||
| 45 | 5-7 | Pittsburgh | ||||||
| 46 | 8-4 | Troy | ||||||
| 47 | 7-6 | Michigan St | ||||||
| 48 | 8-5 | Arkansas | ||||||
| 49 | 10-3 | Boise St | ||||||
| 50 | 7-6 | Texas A&M | ||||||
| 51 | 9-4 | Texas Tech | ||||||
| 52 | 4-8 | North Carolina | ||||||
| 53 | 4-9 | Washington | ||||||
| 54 | 8-5 | Kentucky | ||||||
| 55 | 7-6 | Oklahoma St | ||||||
| 56 | 5-7 | Miami-Florida | ||||||
| 57 | 6-7 | Colorado | ||||||
| 58 | 4-8 | Stanford | ||||||
| 59 | 3-9 | Mississippi | ||||||
| 60 | 5-7 | Wyoming | ||||||
| 61 | 5-7 | Washington St | ||||||
| 62 | 8-5 | Purdue | ||||||
| 63 | 7-6 | Southern Miss | ||||||
| 64 | 6-6 | Louisville | ||||||
| 65 | 3-9 | Notre Dame | ||||||
| 66 | 5-7 | Kansas St | ||||||
| 67 | 10-4 | UCF†CUSA | ||||||
| 68 | 5-7 | North Carolina St | ||||||
| 69 | 9-4 | Fresno St | ||||||
| 70 | 7-6 | Indiana | ||||||
| 71 | 7-6 | Ball State | ||||||
| 72 | 2-10 | UNLV | ||||||
| 73 | 3-9 | Colorado St | ||||||
| 74 | 5-7 | Middle Tenn St | ||||||
| 75 | 5-7 | Nebraska | ||||||
| 76 | 8-5 | East Carolina | ||||||
| 77 | 12-1 | Hawaii†WAC | ||||||
| 78 | 6-7 | Miami-Ohio | ||||||
| 79 | 3-9 | Iowa State | ||||||
| 80 | 6-6 | UL Monroe | ||||||
| 81 | 6-6 | Northwestern | ||||||
| 82 | 8-5 | Florida Atlantic†SBC | ||||||
| 83 | 1-11 | Duke | ||||||
| 84 | 4-8 | San Diego St | ||||||
| 85 | 2-10 | Syracuse | ||||||
| 86 | 5-7 | Buffalo | ||||||
| 87 | 5-7 | Arkansas St | ||||||
| 88 | 8-5 | Houston | ||||||
| 89 | 5-7 | Western Michigan | ||||||
| 90 | 8-5 | Navy | ||||||
| 91 | 3-9 | Marshall | ||||||
| 92 | 10-4 | Tulsa | ||||||
| 93 | 1-11 | Minnesota | ||||||
| 94 | 8-5 | Bowling Green | ||||||
| 95 | 6-7 | Nevada | ||||||
| 96 | 5-7 | San Jose St | ||||||
| 97 | 4-8 | Temple | ||||||
| 98 | 5-7 | Louisiana Tech | ||||||
| 99 | 8-6 | Central Michigan†MAC | ||||||
| 100 | 4-8 | Akron | ||||||
| 101 | 4-8 | Eastern Michigan | ||||||
| 102 | 2-10 | Utah St | ||||||
| 103 | 3-9 | Baylor | ||||||
| 104 | 3-9 | Kent St | ||||||
| 105 | 6-6 | Ohio | ||||||
| 106 | 4-8 | Tulane | ||||||
| 107 | 7-6 | Memphis | ||||||
| 108 | 3-9 | Army | ||||||
| 109 | 2-10 | Northern Illinois | ||||||
| 110 | 3-9 | UL Lafayette | ||||||
| 111 | 7-5 | Western Kentucky | ||||||
| 112 | 5-7 | Toledo | ||||||
| 113 | 4-8 | UTEP | ||||||
| 114 | 2-10 | UAB | ||||||
| 115 | 1-11 | Florida Intl | ||||||
| 116 | 1-11 | Idaho | ||||||
| 117 | 1-11 | SMU | ||||||
| 118 | 4-9 | New Mexico St | ||||||
| 119 | 2-10 | North Texas | ||||||
| 120 | 3-9 | Rice |
|
In all of the above analysis we've been aggregating team performance by conference. In the left sidebar we have the first comparison by conference metrics, namely the order defined by the rank distribution of its teams in scoring offense and scoring defense.
I didn't specifically break "ties", but ordered tied conferences by the normalized scoring defense metric, since from what we described above it appears that defense played the larger role in determining conference champions.
We're still not going to say "the SEC is better than the Big 12", or "the Pac 10 is better than the ACC." But whether by plain dumb luck or clever scheduling or, maybe, having better teams, we can safely say that the SEC and Pac 10 had better years than any of the other collections of teams called "conferences."
And there's lots of team-oriented data in these results that can be used to explain or analyze the crazy 2007 season.
But that can wait for the offseason, since this is too long already.