Last year I used what I called a "surprise factor" to assign a weight to "upsets" according to the various rating systems. I never really liked the weighting I used in the Weighted Retrodictive Ranking Violation report, because the weights tended to zero too quickly. An upset of #25 only contributed .04 × ΔScore×ΔRank.
During the college baseball season I finally got around to defining an improvement, using these criteria:
The improved calculation is:
| |||||
|
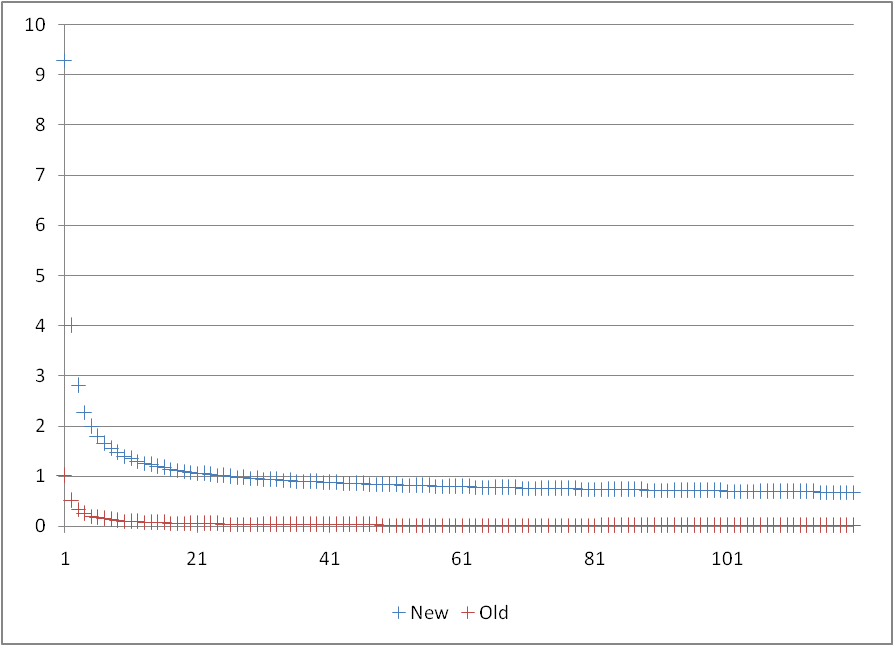
For FBS football with 120 teams, N=25 seems a logical choice, and the resulting weightings by loser's rank look like this:
With the new calculation, the WRRV for 2007 looks like this. Be careful with the interpretations, QPR is only "best" by this metric because it only ranks 50 teams.
| Top 10 Games for 28 Aug-1 Sep | ||||||||||||||||||||||||||||||||||||||||||
|
To find the most interesting games, just use Game Interest = (M+1−MAX(R1,R2))׃(R1,R2) (where M is the number of ranked teams - in all of this, M+1 is the rank assigned to any unranked team.)
The coefficient (M+1)-(rank of lower-rated team) just gives a multiplier of 1 for the worst team up to 120 (for D-1A) for a game involving the #1 team. The highest value for a regular-season game in 2008 based upon 2007 rankings is 1086.9 for #4 Georgia at #1 LSU. In fact, the top 9 are all games involving LSU, but this is ok - games involving the #1 are inherently of interest. Even if the opponent's rank is really bad, the game is interesting because an upset would be a really big one.
For the first weekend, the algorithm gives these as the top 10 games.
If strikes me that if we choose N so that playing the team ranked last counts as close to ½ as we can get we can define another reasonable measure of schedule strength. The derivation of that will come in another essay.